
Articles
- Page Path
- HOME > Restor Dent Endod > Volume 51(2); 2026 > Article
- Research Article Interplay of hypoxia, angiogenesis, and macrophages in pulp and periapical lesions: an immunohistochemical cross-sectional study
-
Puja Chatterjee1
 , Mala Kamboj1,*, Shweta Mittal2, Anjali Narwal1, Anju Devi1
 -
Restor Dent Endod 2026;51(2):e22.
DOI: https://doi.org/10.5395/rde.2026.51.e22
Published online: April 23, 2026
1Department of Oral and Maxillofacial Pathology and Microbiology, Post Graduate Institute of Dental Sciences, Pt B.D. Sharma University of Health Sciences, Rohtak, India
2Department of Conservative Dentistry and Endodontics, Post Graduate Institute of Dental Sciences, Pt B.D. Sharma University of Health Sciences, Rohtak, India
- *Correspondence to Mala Kamboj, MDS, MAMS, MNASc Department of Oral and Maxillofacial Pathology and Microbiology, Post Graduate Institute of Dental Sciences, Pt B.D. Sharma University of Health Sciences, Rohtak 124001, Haryana, India Email: malskam@gmail.com
• Received: June 21, 2025 • Revised: December 18, 2025 • Accepted: January 13, 2026
© 2026 The Korean Academy of Conservative Dentistry
This is an Open-Access article distributed under the terms of the Creative Commons Attribution Non-Commercial License (http://creativecommons.org/licenses/by-nc/4.0) which permits unrestricted non-commercial use, distribution, and reproduction in any medium, provided the original work is properly cited.
- 874 Views
- 48 Download
Abstract
-
Objectives This study evaluated and correlated the immune expression of hypoxia and angiogenesis with macrophages in periapical granuloma (PG), radicular cyst (RC), and healthy pulp (HP).
-
Methods An observational study was performed on 51 tissue blocks equally divided among the groups, stained immunohistochemically for hypoxia-inducible factor (HIF)-1α, vascular endothelial growth factor (VEGF), and CD68, and the mean expression was calculated. Data were analyzed using Kruskal-Wallis, Mann-Whitney, Spearman correlation tests (p < 0.001), and multiple linear regression analysis (p ≤ 0.05).
-
Results HIF-1α expression was highest in PG than RC and HP (p < 0.001). Significant differences were found between HP, PG, and RC (both p < 0.001). VEGF expression was highest in RC than in PG and HP (p < 0.001), with significant differences between HP and both PG and RC (p < 0.001); pairwise comparisons were significant between all groups (p < 0.001, p < 0.001, p = 0.018). Correlation analysis showed significant correlations between VEGF and CD68 in HP and PG (p = 0.007 and p = 0.028, respectively). Linear regression showed that study groups were significantly associated with mean scores of HIF-1α, VEGF, and CD68 (p = 0.002, p = 0.001, p < 0.001).
-
Conclusions HIF-1α, VEGF, and CD68 showed increased expression in PGs and RCs, suggesting an association between hypoxic conditions, enhanced angiogenic activity, and macrophage presence within the periapical inflammatory microenvironment. Future studies exploring HIF-1α and VEGF inhibitors as potential treatment modalities for periapical lesions are warranted.
INTRODUCTION
The dental pulp is a highly vascularized and innervated connective tissue located within the pulp chamber, which plays a vital role in dentin formation and tooth vitality [1]. Periapical lesions such as periapical abscess, periapical granuloma (PG), and radicular cyst (RC) arise from pulpal diseases due to untreated caries, trauma, or infection. Bacterial toxins, tissue debris, and immune responses contribute to inflammation, tissue damage, and bone destruction around the root apex [2]. Angiogenesis, epithelial cell proliferation, and autophagy are induced by ischemic hypoxia and nutrient depletion in the central areas of inflamed periapical lesions, leading to cyst formation and progression [3].
Ischemic hypoxia is a condition characterized by reduced blood flow and insufficient oxygen supply to a tissue or organ, leading to cellular oxygen deprivation. In periapical lesions, ischemic hypoxia develops primarily due to infection-induced inflammation. The inflammatory process leads to swelling, increased interstitial pressure, and compression of local blood vessels, which collectively diminish perfusion. As inflammation exacerbates, vascular congestion and impaired microcirculation further limit oxygen delivery, contributing to tissue damage and necrosis, ultimately forming an abscess [3].
At the cellular level, hypoxia triggers a cascade of molecular events. Hypoxia-inducible factor 1 (HIF-1) acts as a central regulator of cellular adaptation to decreased oxygen availability. It consists of two subunits—HIF-1α, which is oxygen-sensitive, and HIF-1β, which is constitutively expressed. Under normoxic conditions, HIF-1α is rapidly degraded; however, under hypoxic conditions, HIF-1α stabilizes and accumulates. This stabilization initiates transcription of multiple genes involved in angiogenesis, cell survival, metabolism, and inflammation [4].
HIF-1α induces several proangiogenic molecules, including vascular endothelial growth factor (VEGF), basic fibroblast growth factor, platelet-derived growth factor-B, and angiopoietins 1 and 2, which collectively promote new blood vessel formation to restore oxygen supply [4]. In addition to angiogenesis, hypoxia and inflammation can stimulate autophagy, an essential cytoprotective mechanism enabling cells to degrade damaged components and recycle energy substrates. Autophagy interacts closely with inflammatory pathways and may contribute to the survival and persistence of cells within hypoxic regions of periapical lesions [3].
Angiogenesis (neovascularization) and vasculogenesis are mediated by signaling proteins such as VEGF. It is a critical factor in promoting new vessel formation and vascular permeability, which helps in wound healing [5,6]. VEGF has several isoforms that exert biological activity via specific tyrosine kinase receptors. The presence of VEGF in periapical lesions indicates the potential for healing and repair of affected tissues. VEGF is also said to attract and activate macrophages, which release cytokines and growth factors that promote angiogenesis [5].
Macrophages play a pivotal role in the pathogenesis of periapical lesions by regulating immune responses and mediating tissue destruction and repair. In response to bacterial invasion from necrotic pulp, they infiltrate periapical tissues and exhibit phenotypic plasticity, transitioning between pro-inflammatory (M1) and anti-inflammatory (M2) states [7]. M1 macrophages arise primarily through classical pathway activation and produce cytokines such as interleukin (IL)-1, IL-6, and tumor necrosis factor alpha (TNF-α), as well as reactive oxygen and nitrogen intermediates. These mediators create a microbicidal environment, support Th1 immune responses, and contribute to sustained inflammation [7,8]. In contrast, M2 macrophages, associated with alternative pathway activation, secrete immunosuppressive cytokines such as IL-10, IL-13, and growth factors like transforming growth factor beta, facilitating immunomodulation, tissue remodeling, angiogenesis, and repair [7,8].
This dynamic M1–M2 balance influences lesion progression and healing potential, making macrophage polarization a relevant therapeutic target. Immunohistochemical studies frequently use CD68 as a general macrophage marker; however, because CD68 identifies both phenotypes, additional polarization-specific markers are essential to distinguish M1 and M2 populations in periapical lesions [8].
Therefore, whether a hypoxic environment enhances angiogenesis and attenuates macrophage activity remains to be determined. To date, no study has evaluated the combined effect of these three parameters in pulp and periapical lesions. The present study was conceived to detect the expression of hypoxia, angiogenesis, and immunogenic potential using immunohistochemical expression of HIF-1α, VEGF, and CD68 in healthy pulp (HP) tissue, PG, and RC. Their correlation, if any, would shed insight into the pathological mechanism and help to establish strategies to improve the success rate of the treatment of pulp and periapical diseases.
METHODS
The present observational cross-sectional study was carried out following approval from the Biomedical Health and Research Committee (approval No. PGIDS/BHRC/23/36). It was conducted in compliance with the ethical principles outlined in the 10th version of the Declaration of Helsinki (October 2013, accessible at www.wma.net). Additionally, this observational study has been written according to the STROBE (STrengthening the Reporting of OBservational studies in Epidemiology) guidelines.
The study included a descriptive analysis of the immunohistochemical expression of HIF-1α, VEGF, and CD68 in 51 formalin-fixed, paraffin-embedded tissue sections comprising 17 cases each of HP, PG, and RC, obtained from prospective biopsy specimens received from May 2022 to May 2023. The criteria to include and exclude cases that determined the eligibility for participation in this study are outlined in Figure 1. Patient data, including age and sex, were obtained from biopsy records. Pathological diagnoses were confirmed based on clinical, radiographic, and histological criteria. HP tissue was obtained from extracted teeth that were free of caries and apical periodontitis, including those extracted for surgical indications such as third-molar removal. The pulp was immediately retrieved using a sterile high-speed fissure bur, and all cases were histopathologically confirmed as HP tissue. The study included human permanent, mature teeth from all quadrants. All selected specimens were periapical radiolucent lesions of varying sizes associated with non-vital pulp (Figure 2). PG consisted of granulomatous tissue with inflammatory cell infiltration, lacking an epithelial lining. RC was identified as fully developed cavities lined by stratified squamous epithelium of varying thickness with a fibrous wall [8].
Keeping an effect size of 0.7, an alpha level of 5%, and 90% power of the study using G*Power ver. 3.1 (Heinrich Heine University Düsseldorf, Düsseldorf, Germany), a sample of 14 in each group was calculated [9]. However, keeping in mind the exhaustion of tissues in paraffin blocks or stain failure, 17 cases per group were recruited.
All samples underwent macroscopic examination and were appropriately grossed to allow a comprehensive histological analysis of periapical lesions. Tissue sections, 4 μm thick, were prepared from formalin-fixed, paraffin-embedded blocks of HP, PG, and RC. These sections were mounted on glass slides, stained with hematoxylin and eosin, and examined under light microscopy (A, B, and C panels of Figures 3–5). Histopathological evaluation focused on characteristic features such as the epithelial lining, inflammatory cell infiltrate, and connective tissue organization, which formed the basis for the definitive diagnosis of RC, PG, or HP. The histopathologic diagnosis was performed by experienced oral pathologists.
For immunohistochemical staining, 4-μm-thick tissue sections were obtained from formalin-fixed, paraffin-embedded tissue blocks and mounted on poly-lysine-coated glass slides. Three sections were deparaffinized, rehydrated through a graded alcohol series, and then hydrated with deionized water. Antigen retrieval was performed using Tris-EDTA (pH 9) in a pressure cooker. Sections were then incubated separately for 1 hour at room temperature in a humidified chamber with primary antibodies: monoclonal rabbit anti-human HIF-1α antibody (clone EP118; BioGenex, Fremont, CA, USA; ready-to-use), monoclonal rabbit anti-human VEGF antibody (clone ZR389; ZETA Corporation, Sierra Madre, CA, USA; ready-to-use) and monoclonal mouse anti-human CD68 antibody (clone PG-M1; Diagnostic Biosystems, Pleasanton, CA, USA; ready-to-use). To facilitate primary antibody binding, sections were treated with a supersensitive one-step polymer horseradish peroxidase kit (Biogenex) for 30 minutes following two washes with phosphate-buffered saline.
Peroxidase activity was visualized by immersing sections in diaminobenzidine (HK124-5K; Biogenex) chromogen for 10 minutes at room temperature, producing a brown reaction product. The sections were counterstained with Mayer’s hematoxylin and cover-slipped. Positive controls included breast carcinoma sections for anti-HIF-1α and VEGF and tonsil sections for anti-CD68. Negative controls consisted of sections where the primary antibody was omitted and replaced with phosphate-buffered saline.
Immunohistochemical analysis was performed by two independent oral and maxillofacial pathologists (PC and MK). The slides were evaluated under a brightfield research microscope. Photomicrographs were captured using a DS-Fi3 digital camera (Nikon, Tokyo, Japan) and analyzed using NIS-Elements imaging software (Nikon) to assess primary antibody expression.
1. Quantification of hypoxia using hypoxia-inducible factor-1α
To evaluate the expression of HIF-1α, the stained slides were examined under various magnifications (40×, 100×, and 400×) to identify the pattern of positive staining under the microscope. For quantification, six random fields from each immunostained section were selected at 400× magnification. The percentage of positive IHC staining (P) was categorized as follows: 0 (0%–4%), 1 (5%–24%), 2 (25%–49%), 3 (50%–74%), and 4 (75%–100%). The intensity of staining (I) was scored as 0 for no staining, 1 for weak staining (light yellow), 2 for moderate staining (brown), and 3 for strong staining (dark brown). The total score (S) for each section was then calculated as P × I, following the method described by Huang et al. [3].
2. Quantification of angiogenesis using vascular endothelial growth factor
VEGF immunohistochemical expression was assessed in the connective tissue of PG, RC, and HP, as well as in the epithelial lining of RC. In the connective tissue, a quantitative evaluation of immunopositive cells, regardless of staining intensity, was conducted following the method by Freitas et al. [10]. Tissue sections were examined under light microscopy at 100× magnification to identify five fields with the highest number of immunostained cells. At 400× magnification, immunopositive cells were counted in each field. Cell counts were expressed as the mean number of positive cells in these areas obtained for each sample [6]. The VEGF immunoexpression in the epithelial lining of RCs was evaluated semi-quantitatively using 100× magnification. Based on an adaptation of the method by Leonardi et al. [11], epithelial VEGF immunoexpression was classified as follows: no staining in 10% of cells; weak staining in 11%–25% of cells; moderate staining in 26%–75% of cells; and strong staining in more than 76% of cells [6].
3. Quantification of macrophages using CD68
For the quantification of macrophages, CD68 monoclonal antibody staining was performed to confirm the nature of macrophages. For the CD68 antibody, five representative and random fields were selected after identifying the highest immunoreactivity areas at a 100-μm scale. CD68+ cell counts were performed at 400×, and the positivity index (PI) was adopted based on a previously described method [7]. Data were reported as the percentage of positive cells presenting brownish cytoplasmic staining in each sample. The PI was calculated by applying the formula (PI) = (number of immunopositive cells) / (number of counted cells) × 100 [7].
4. Assessment of interobserver agreement
To ensure scoring reliability, two independent oral and maxillofacial pathologists (PC and MK) evaluated all immunostained slides. Interobserver agreement was assessed using Cohen’s kappa statistic, which demonstrated excellent reliability across markers—HIF-1α (κ = 0.92), VEGF (κ = 0.94), and CD68 (κ = 0.91)—with all values falling within a 95% confidence interval.
Data were analyzed for descriptive statistics and imported into the IBM SPSS ver. 21.0 for Windows (IBM Corp, Armonk, NY, USA) for inferential analysis. The Shapiro-Wilk test for normality indicated a non-normal distribution. Therefore, the nonparametric Kruskal-Wallis H-test was applied to compare the means between the three groups. The Mann-Whitney U-test was used as a post hoc test to assess statistical differences between the two groups. Spearman’s rho was used to evaluate the relationship among the three parameters within the same group. A p-value of >0.05 was considered nonsignificant, and p < 0.05 was considered statistically significant. Multiple linear regression was used to assess the effects of independent variables (age, sex, site, and study groups [HP, PG, and RC]) on the mean scores of HIF-1α, VEGF, and CD68 as dependent variables.
RESULTS
A total of 30 males and 21 females participated in the study. PG, RC, and HP comprised 13 males (76.5%), four females (23.5%); seven males (41.2%), 10 females (58.8%); and 10 males (58.8%), seven females (41.2%), respectively. The mean age of occurrence was 32.82 years for the three groups. Demographic details, along with lesion location, have been summarized in Table 1.
1. Hypoxia-inducible factor-1α expression
Stronger cytoplasmic and intense nuclear staining of HIF-1α was observed in all samples of PG and RC compared to HP (D, E, and F panels of Figures 3–5). In PG and RC, staining was prominent in inflammatory cells, including macrophages, lymphocytes, and polymorphonuclear neutrophils, as well as in endothelial cells and fibroblasts. Additionally, all layers of the epithelial lining of RC and inflammatory cells within the cystic capsule showed positive staining. However, in HP, HIF-1α staining was limited to fibroblasts and endothelial cells (Figures 3–5). The mean HIF-1α expression was highest in PG, followed by RC and HP, and their comparison was significant (p < 0.001) (Table 2). Upon applying the Mann-Whitney test for intergroup comparison, expression of HIF-1α was significantly higher in PG and RC than in HP (p < 0.001 for both), while that between PG and RC was not significant (p = 0.865) (Table 3).
2. Vascular endothelial growth factor expression
VEGF was evaluated in blood vessels, inflammatory infiltrate (mainly lymphocytes, plasma cells, and neutrophils), and stromal cells (fibroblasts). Overall, VEGF exhibited pronounced cytoplasmic positivity across all study groups. Immunohistochemical assessment was conducted in the connective tissue of PG, RC, and HP, as well as in the epithelial lining of RC (G, H, and I panels of Figures 3–5). VEGF expression was highest in RC than in PG and HP, and this difference was significant (p < 0.001) (Table 2). Upon intergroup comparison, the expression of VEGF was significantly higher in PG and RC than in HP (p < 0.001 for both); however, the difference between PG and RC was not significant (p = 0.454) (Table 3). The analysis of VEGF immunoreactivity in the epithelium of RCs revealed weak expression in one case (5.9%), moderate expression in six (35.3%), and strong expression in 10 cases (58.8%).
3. CD68 expression
Both lysosomal granules and the surface of macrophages expressed the CD68 antibody. Macrophage immunostaining was more prominent in the subepithelial regions of RC and the middle areas of PG (J, K, and L panels of Figures 3–5). The mean CD68 expression was significantly higher for RC than PG and HP (p < 0.001) (Table 2). Upon intergroup comparison, the expression of CD68 was significantly higher in RC and PG than in HP, and significantly higher in RC than in PG (p < 0.001, p < 0.001, and p = 0.018, respectively) (Table 3).
4. Correlation of hypoxia-inducible factor-1α with vascular endothelial growth factor expression and macrophages across study groups
Upon application of the Spearman correlation test, HIF-1α in HP, PG, and RC showed a nonsignificant correlation with VEGF (p = 0.916, p = 0.516, p = 0.286) and CD68 (p =0.860, p = 0.205, p = 0.535), respectively. However, a significant positive correlation between VEGF and CD68 was found in HP (r = 0.630, p = 0.007) and PG (r = 0.532, p = 0.028), but not in RC (p = 0.204) (Table 4). The linear regression results were nonsignificant for the independent variables (age, sex, and site); however, the study groups (HP, PG, and RC) remained significantly associated with the mean scores of HIF-1α, VEGF, and CD68 (Table 5). A summary of the key immunohistochemical findings across the study groups has been provided in Table 6.
DISCUSSION
Periapical lesions are inflammatory responses to anaerobic polymicrobial infections of the dental pulp and root canals [12]. During inflammation, a hypoxic microenvironment activates HIFs, particularly HIF-1α, a key regulator of cellular responses to low oxygen levels [13]. In hypoxic conditions (oxygen concentration ≤2%), HIF-1α stabilizes and alters gene expression, promotes hypoxic adaptation, and influences the inflammatory environment [13]. Hypoxia is linked to processes like proliferation, angiogenesis, and apoptosis, which are essential for the development of a periapical lesion [14]. Elevated HIF-1α levels play a central role and influence macrophage polarization by regulating inducible nitric oxide synthase [12]. The current study was designed to evaluate and correlate the expression of HIF-1α, VEGF, and CD68 (a macrophage marker) in PG, RC, and HP.
The proliferation of cells and formation of cellular aggregates in periapical lesions can restrict oxygen diffusion to the lesion center, leading to hypoxia [15]. In the present study, HIF-1α expression levels were highest in PG, followed by RC, and least in HP, which was significant (p < 0.001) (Figures 3–5). The comparison of HIF-1α expression between HP and PG and HP and RC was also significant (p < 0.001 for both); however, the intergroup comparison between PG and RC was not significant (Tables 2 and 3).
Huang et al. [3] also reported higher HIF-1α expressions in PG and RC compared with HP, with no significant difference between PG and RC. Their values were higher than those in the present study, likely due to differences in lesion size, inflammation, and genetic factors. It could be hypothesized that the elevated HIF-1α in PGs may result from increased inflammatory activity, in which macrophages and lymphocytes create a hypoxic microenvironment via cytokine release, particularly IL-1β (Figure 3). In contrast, RCs experience hypoxia due to ischemia from cystic cavity formation but have lower inflammation-driven hypoxia (Figure 4) [3].
Conversely, Alsaegh et al. [15] and da Costa et al. [14] found significantly higher HIF-1α in RC, attributing it to epithelial proliferation, ischemic microenvironment, and increased metabolic demand. The cystic structure restricts oxygen diffusion, stabilizing HIF-1α. Based on the present study findings, it could be hypothesized that higher HIF-1α expression in PG than RC may be due to the acute and dynamic inflammatory environment in PG, which increases metabolic demand and oxygen consumption, intensifying hypoxia. The intense immune cell infiltration and active tissue remodeling in PG further amplify HIF-1α expression. Also, the fluctuating oxygen levels in PG may drive transient HIF-1α activation, whereas the more stable, chronic hypoxia in RC results in relatively lower expression. The lack of an epithelial lining in PG could also allow broader HIF-1α expression across stromal and inflammatory cells. The expression levels in PG and RC were comparable, with no significant difference, although the PG group showed slightly higher values. Thus, there was a hypoxic environment in both RC and PG, albeit this was slightly higher in PG due to a greater inflammatory response.
HIF-1α is closely linked to the VEGF pathway, with its connection being evident across various physiological and pathological conditions [15]. Activation of HIF-1α directly upregulates VEGF expression, playing a pivotal role in stimulating new blood vessel formation and supporting tissue repair through angiogenesis [15]. VEGF expression levels were highest in RC, followed by PG, and lowest in HP, with a significant difference (p < 0.001) (Figures 3–5). The comparison of VEGF expression of HP with PG and RC was significant (p < 0.001 for both) and not significant for PG and RC (p = 0.454) (Tables 2 and 3).
Similar results were reported by Nonaka et al. [6] and Alsaegh et al. [15], who observed higher VEGF expression in RC than in PG. Nonaka et al. [6] found mean VEGF-positive cells in PGs (564.90), RCs (565.05), and lower in residual RCs (443.90), with strong VEGF expression in the epithelial lining of RCs. This might be due to geographic, genetic, and environmental differences, as well as methodological variations. Alsaegh et al. [15] reported significantly higher VEGF in RCs (p = 0.015), with strong expression in 33.3% of RCs vs 11.1% of PGs. However, their study did not quantify VEGF expression, unlike Nonaka et al. [6] and the current study. VEGF upregulation in RC may be driven by chronic inflammation, bacterial toxins, and cytokines such as IL-1β and RANTES. In RC, dense inflammatory infiltration stimulates VEGF release from macrophages and neutrophils, while the epithelial lining enhances vascular permeability and lesion growth. Unlike PG, in which VEGF is mainly expressed in inflammatory cells, RC shows stronger epithelial VEGF expression, promoting cyst expansion and chronic inflammation.
In contrast, Fonseca-Silva et al. [16] reported higher VEGF expression in PG than in RC, though this difference was not significant. The lower VEGF values in the current study might be due to different evaluation criteria as the former study performed immunohistochemical analysis of VEGF by determining the percentage of positive-staining cells in 10 microscopic fields for each specimen, whereas the present study quantified the mean expression of VEGF in the connective tissue and assessed the semi-quantitative immunoexpression in the epithelial lining of RCs. Leonardi et al. [11] found strong VEGF expression in inflammatory cells of non-epithelialized PGS, while epithelialized PGS showed moderate staining in inflammatory cells and strong positivity in epithelial cells. RC exhibited consistent VEGF expression across all epithelial layers with minimal inflammatory staining. Higher VEGF in PG might result from early lesion development, where inflammatory cells drive angiogenesis and vascular hyperpermeability. In RC, epithelial cells become the primary VEGF source, maintaining vascular permeability and cyst growth rather than initiating angiogenesis. Thus, PGs exhibit higher VEGF expression driven by inflammation, whereas RCs rely on epithelial VEGF and exhibit cystic characteristics. The chronicity of inflammation in RCs also contributes to sustained VEGF levels, as prolonged inflammatory processes result in ongoing recruitment and activation of macrophages and other immune cells that further drive angiogenic signaling.
Macrophages play a crucial role in periapical lesions by modulating the immune response and maintaining tissue homeostasis. Due to their plasticity, macrophages adapt to microenvironmental changes, impacting lesion progression and healing [7]. In the present study, CD68 expression was highest in RC, followed by PG, and lowest in HP, with a significant difference (p < 0.001) (Figures 3–5). The intergroup comparison of CD68 expression between all groups showed significant findings (Tables 2, 3). Similar to the present study, França et al. [7] and Azeredo et al. [17] reported higher CD68 expression in RC than PG, though with no significant difference. Variations in the methodologies could be the probable reason for differences in values. Bolan et al. [18] found macrophages diffusely distributed in periradicular lesions, contributing to expansion via IL-1 and TNF-α. de Almeida et al. [19] observed higher CD68 expression in cysts and granulomas of younger adults compared to older patients, suggesting a more active immune response in the young, potentially influencing endodontic outcomes. Contrary to the current study, Rodini and Lara [20] and Weber et al. [21] reported higher CD68 expression in PG than RC, though the difference was not significant. Increased macrophage recruitment in RC supports tissue remodeling, immune regulation, and lesion expansion through IL-1 and TNF-α, promoting bone resorption and epithelial proliferation [22]. Higher T helper 2 cytokines (IL-6, prostaglandins) enhance macrophage differentiation and chronic inflammation [22]. Predominantly located subepithelially, macrophages aid in antigen presentation and immune modulation. As RC matures, it stabilizes through macrophage-driven inflammation and tissue repair, whereas PGs exhibit a more acute inflammatory response [7,8].
HIF-1α and VEGF are closely interconnected in numerous physiological and pathological processes. Hypoxia was correlated with angiogenesis in the current study to analyze their interrelationship in the study groups, which was found to be nonsignificant for the groups (Table 4). VEGF expression was also correlated with macrophages to assess their interplay in periapical lesions. In the HP and PG groups, VEGF showed a significant positive correlation with CD68 expression (p = 0.007 and p = 0.028, respectively) while in the RC group it was not significant (p = 0.417), indicating an active role of macrophages in VEGF-mediated angiogenesis. This association is likely driven by a hypoxic microenvironment that enhances macrophage activation and VEGF production. No study has correlated VEGF with macrophages in periapical lesions. The present study findings could pave the way for future studies that could correlate these expressions for more insight into their role in the pathogenesis of periapical lesions.
HIF-1α and VEGF may serve as potential molecular targets for future investigation in preclinical models of periapical lesions. Exploring the modulation of these pathways could help clarify their role in inflammation, bone resorption, and tissue repair, providing a basis for future translational research. Therapies such as edaravone, which modulates the HIF-1α–VEGF–ANG-1 axis, and VEGF inhibitors like bevacizumab have demonstrated their potential in controlling angiogenesis and bone loss in other inflammatory conditions [15]. Furthermore, combining anti-VEGF treatments with antimicrobials like moxifloxacin has shown rapid lesion regression, suggesting the potential for adaptation in the treatment of periapical lesions to enhance healing outcomes [23].
CONCLUSIONS
This study demonstrated distinct expression patterns of HIF-1α, VEGF, and CD68 across PG, RC, and HP. HIF-1α and VEGF showed significantly higher expression in PG and RC compared to HP, highlighting the role of hypoxia and angiogenesis in lesion progression. Similarly, macrophage density (CD68) was markedly elevated in RC and PG relative to HP, with RC showing the highest levels. Although VEGF and CD68 exhibited a significant positive correlation in HP and PG, no such correlation was observed in RC. Overall, the inter-marker correlations were nonsignificant, and linear regression analysis confirmed that lesion type, rather than demographic factors or site, was significantly associated with expression patterns.
To our knowledge, this is the first study to investigate and correlate the expressions of HIF-1α, VEGF, and macrophages in periapical lesions. The primary strength of the study lies in the precise methodology employed to assess immunohistochemical expression. However, we could not corroborate the correlation between hypoxia, angiogenesis, and macrophages with previous studies, as no prior research has explored this specific interplay. A further limitation is the use of CD68 as a general macrophage marker without incorporating polarization-specific markers (such as CD80/CD86 for M1 or CD163/CD206 for M2), which restricts insights into functional macrophage subsets. Additionally, the heterogeneity in quantification approaches used for different markers, such as variation in scoring methods and expression assessment, may introduce measurement variability. The limited sample size might also be a drawback, impacting the generalizability of the results. However, the findings do highlight the crucial role these factors play in the development and progression of periapical lesions, providing a foundation for novel therapeutic approaches.
-
CONFLICT OF INTEREST
No potential conflict of interest relevant to this article was reported.
-
FUNDING/SUPPORT
This research was funded vide letter number R&D/UHSR/2024/974 under the Post Graduate Dissertation Support (PGDS-II) Scheme-II, Research Cell, Pt BD Sharma University of Health Sciences, Rohtak, Haryana-124001, India.
-
AUTHOR CONTRIBUTIONS
Conceptualization, Project administration: Kamboj M. Data curation, Resources, Funding acquisition: Chatterjee P, Kamboj M. Formal analysis: Chatterjee P. Funding acquisition: Chatterjee P, Kamboj M. Methodology: Chatterjee P, Mittal S, Devi A. Supervision: Kamboj M, Mittal S, Narwal A. Validation: Kamboj M, Narwal A, Devi A. Writing - original draft: Chatterjee P. Writing - review & editing: Kamboj M, Mittal S, Narwal A, Devi A. All authors read and approved the final manuscript.
-
DATA SHARING STATEMENT
The datasets are not publicly available but are available from the corresponding author upon reasonable request.
Figure 1.
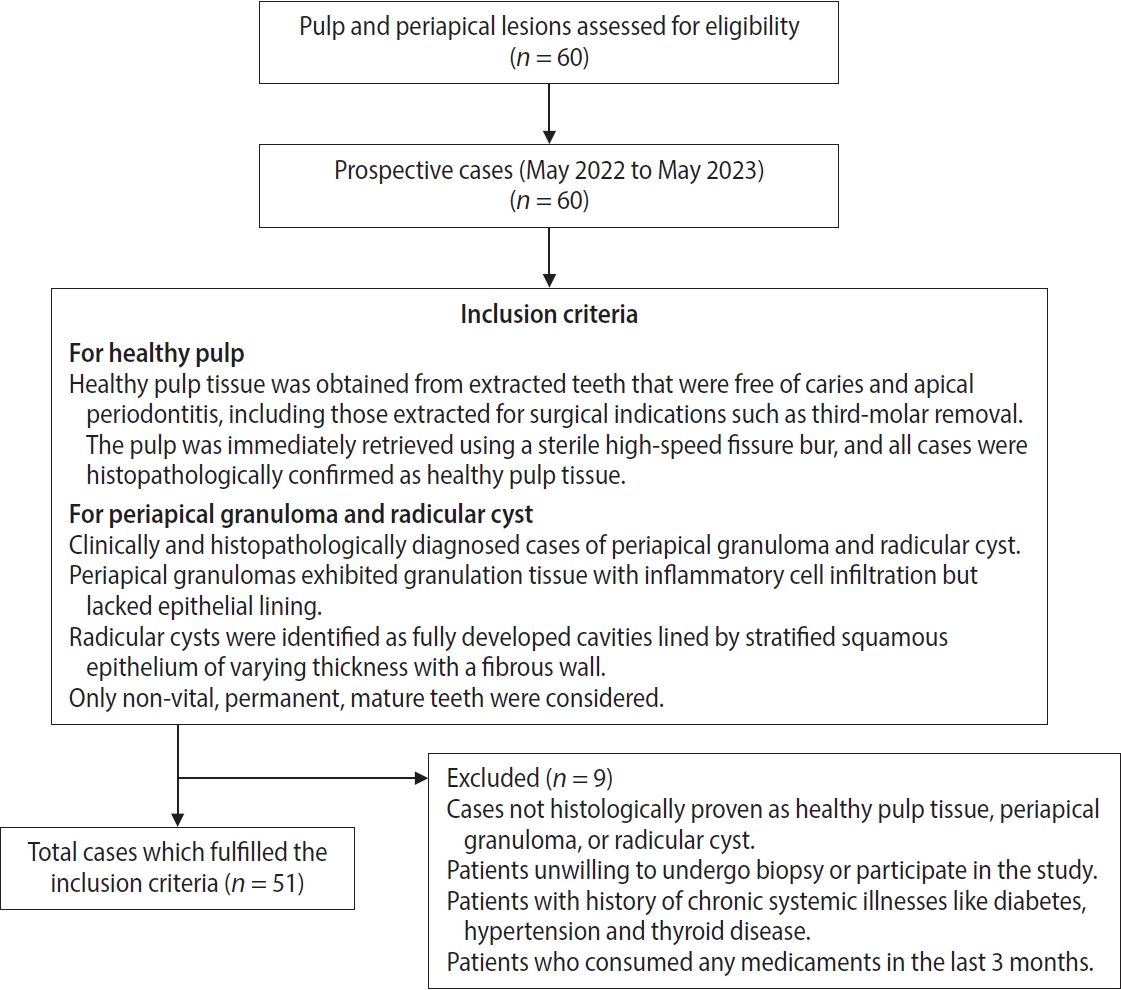
Flow chart depicting the inclusion and exclusion criteria of cases for participation eligibility.
Figure 2.
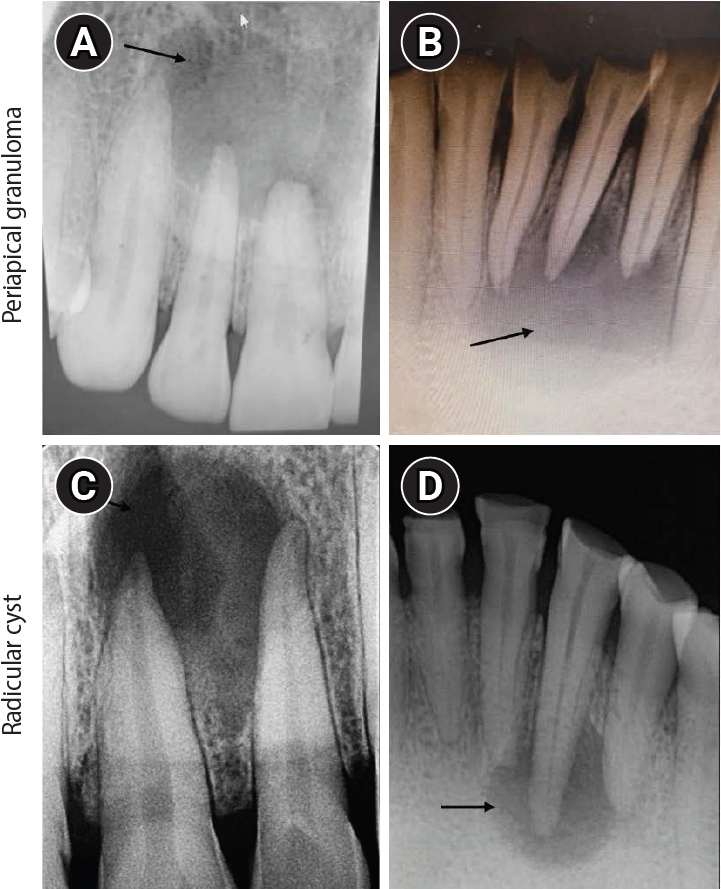
Intraoral periapical radiograph (IOPA) of periapical lesions. (A, B) IOPA of periapical granuloma cases showing well-defined radiolucency with respect to the maxillary right lateral incisor and mandibular right lateral incisor (arrows). (C, D) IOPA of radicular cyst cases showing well-defined radiolucency associated with the root apices of the maxillary left central incisor and mandibular right canine (arrows).
Figure 3.

Hematoxylin and eosin (H&E) and immunoexpression of hypoxia-inducible factor 1 alpha (HIF-1α), vascular endothelial growth factor (VEGF), and CD68 in periapical granuloma. (A–C) Periapical granuloma showing fibrocellular connective tissue stroma infiltrated by intense macrophage-rich inflammatory infiltrate. (D–F) Diffuse immunoexpression of HIF-1α in inflammatory cells, endothelial cells, and fibroblasts of periapical granuloma. (G–I) Diffuse immunoexpression of VEGF in blood vessels, inflammatory infiltrate, and stromal cells (fibroblasts) of periapical granuloma. (J–L) Immunoexpression of CD68 in lysosomal granules and the surface of macrophages of periapical granuloma. A–C: H&E staining. D–F: immunohistochemistry (IHC), anti-HIF-1α. G–I: IHC, anti-VEGF. J–L: IHC, anti-CD68. Images were obtained at ×40, ×100, and ×400 magnifications (scale bars: 100, 50, and 20 μm, respectively).
Figure 4.
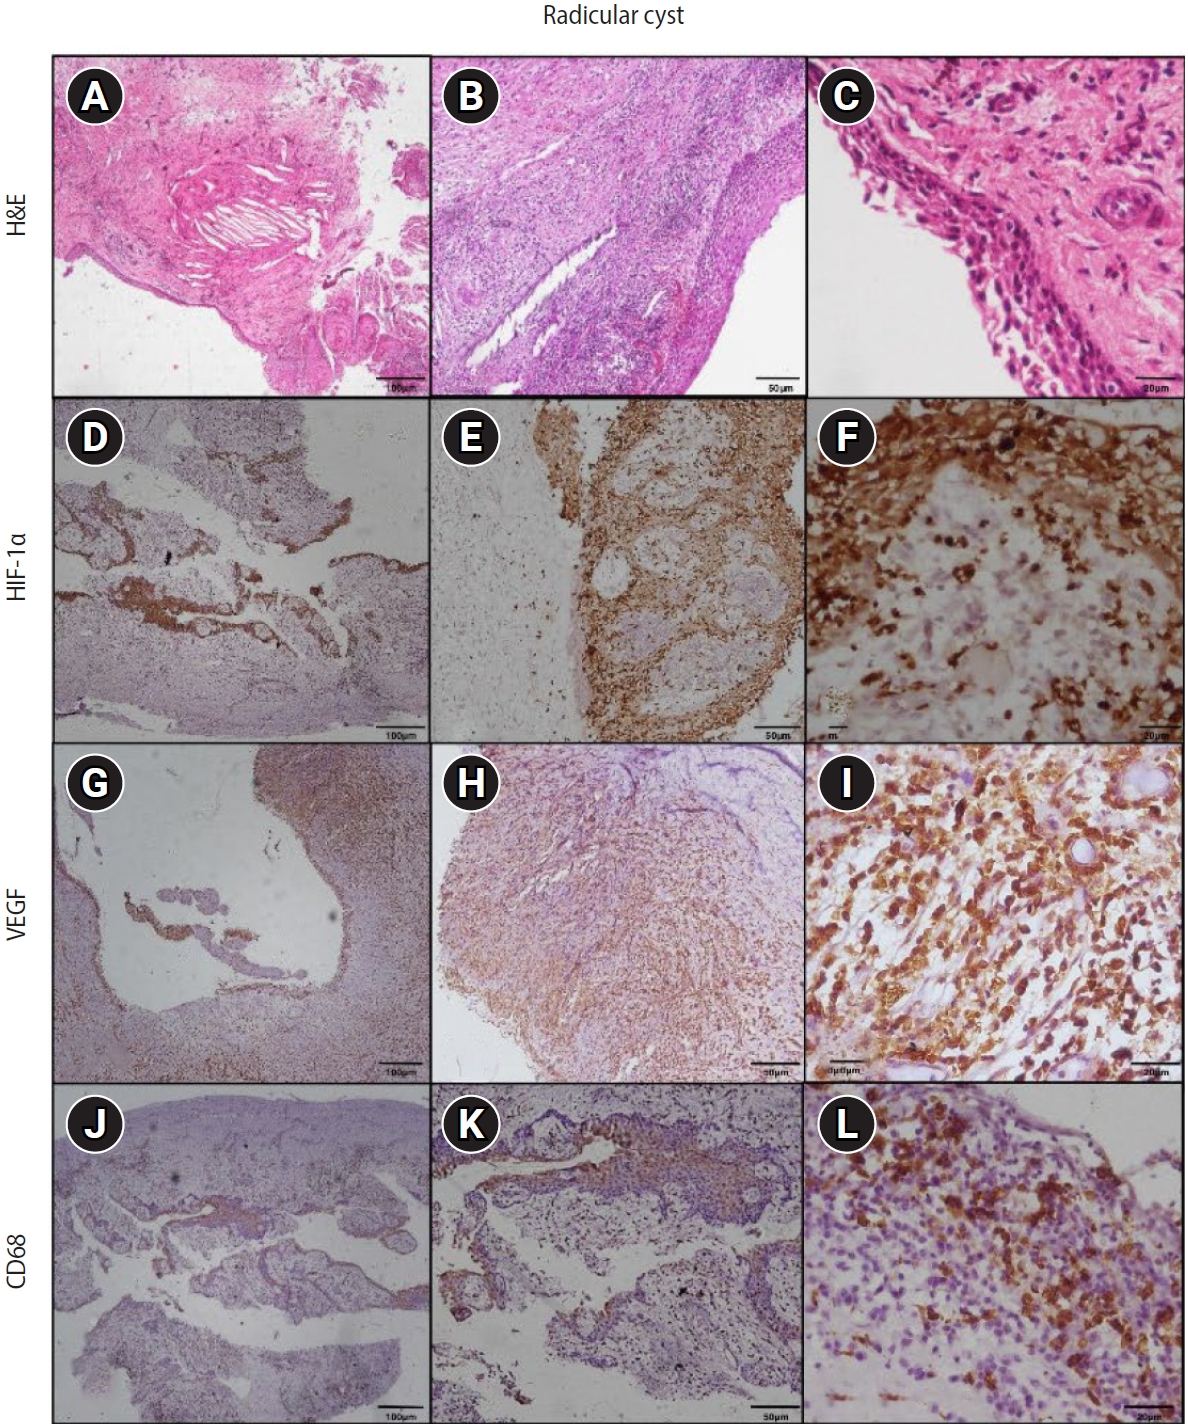
Hematoxylin and eosin (H&E) and immunoexpression of hypoxia-inducible factor 1 alpha (HIF-1α), vascular endothelial growth factor (VEGF), and CD68 in radicular cyst. (A–C) Radicular cyst showing hyperplastic stratified squamous epithelium with an arcading pattern and supporting connective tissue capsule. (D–F) Diffuse immunoexpression of HIF-1α in inflammatory cells, connective tissue, and epithelial lining of radicular cyst. (G–I) Diffuse immunoexpression of VEGF in blood vessels, inflammatory infiltrate, stromal cells (fibroblasts), and epithelial lining of radicular cyst. (J–L) Immunoexpression of CD68 in lysosomal granules and the surface of macrophages of radicular cyst. A–C: H&E staining. D–F: immunohistochemistry (IHC), anti-HIF-1α. G–I: IHC, anti-VEGF. J–L: IHC, anti-CD68. Images were obtained at ×40, ×100, and ×400 magnifications (scale bars: 100, 50, and 20 μm, respectively).
Figure 5.
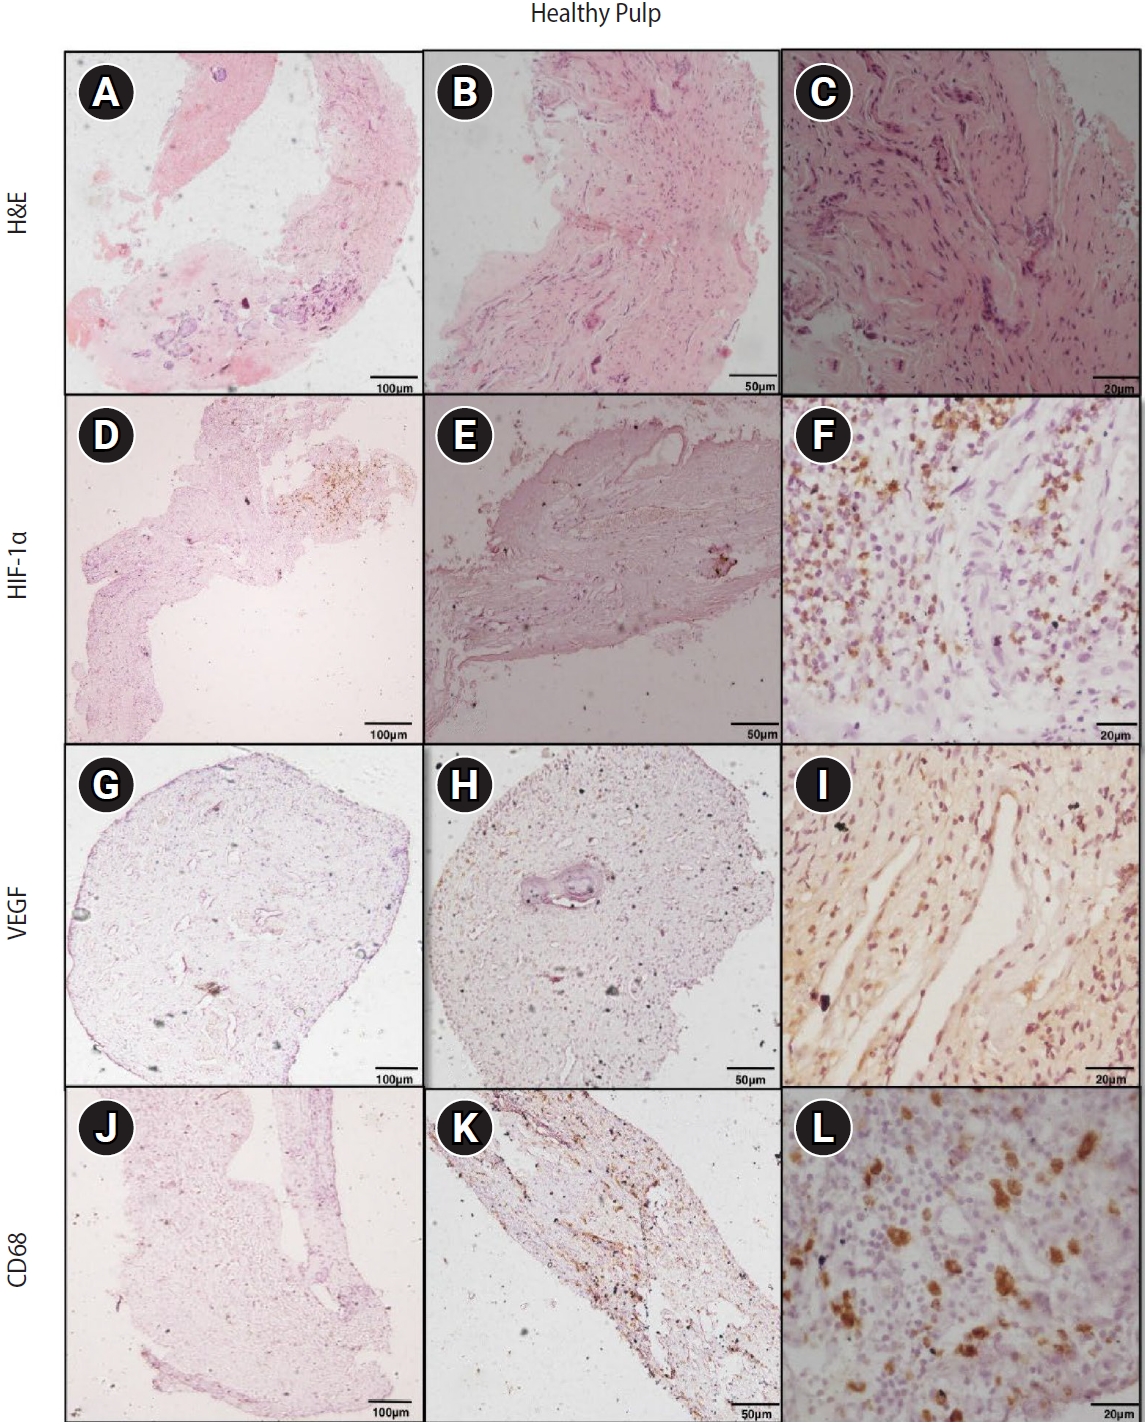
Hematoxylin and eosin (H&E) and immunoexpression of hypoxia-inducible factor 1 alpha (HIF-1α), vascular endothelial growth factor (VEGF), and CD68 in healthy pulp. (A–C) Healthy pulp showing connective tissue stroma with fibroblasts and vascular channels. (D–F) Diffuse immunoexpression of HIF-1α in fibroblasts and endothelial cells. (G–I) Diffuse immunoexpression of VEGF in blood vessels and stromal cells (fibroblasts) of healthy pulp. (J–L) Immunoexpression of CD68 in lysosomal granules and surface of macrophages of healthy pulp. A–C: H&E staining. D–F: immunohistochemistry (IHC), anti-HIF-1α. G–I: IHC, anti-VEGF. J–L: IHC, anti-CD68. Images were obtained at ×40, ×100, and ×400 magnifications (scale bars: 100, 50, and 20 μm, respectively).
Table 1.
Demographic characteristics and lesion site distribution of the study population
Table 2.
Mean expression score of HIF-1α, VEGF, and macrophages (CD68) in healthy pulp, periapical granuloma, and radicular cyst
| Parameters | Healthy pulp | Periapical granuloma | Radicular cyst | p-valuea) |
|---|---|---|---|---|
| HIF-1α | 10.17 ± 9.01 | 25.76 ± 9.08 | 24.65 ± 9.91 | <0.001 |
| VEGF | 28.04 ± 23.71 | 88.56 ± 61.69 | 94.51 ± 49.69 | <0.001 |
| CD68 | 4.16 ± 3.12 | 16.71 ± 7.38 | 23.47 ± 10.25 | <0.001 |
Table 3.
Intergroup comparison of HIF-1α, VEGF, and macrophages (CD68) in healthy pulp, periapical granuloma, and radicular cyst
| Group | p-value | ||
|---|---|---|---|
| HIF-1α expression | VEGF expression | CD68 expression | |
| Healthy pulp and periapical granuloma | <0.001** | <0.001** | <0.001** |
| Periapical granuloma and radicular cyst | 0.865 | 0.454 | 0.018* |
| Healthy pulp and radicular cyst | <0.001** | <0.001** | <0.001** |
Table 4.
Intragroup correlation of HIF-1α, VEGF, and CD68 expressions in healthy pulp, periapical granuloma, and radicular cyst
| Groups | HIF-1α and VEGF | HIF-1α and CD68 | VEGF and CD68 | |||
|---|---|---|---|---|---|---|
| r | p-value | r | p-value | r | p-value | |
| Healthy pulp | –0.028 | 0.916 | –0.046 | 0.860 | 0.630 | 0.007** |
| Periapical granuloma | –0.169 | 0.516 | 0.324 | 0.205 | 0.532 | 0.028* |
| Radicular cyst | 0.275 | 0.286 | 0.162 | 0.535 | 0.211 | 0.417 |
Table 5.
Multiple linear regression analysis on the association of the independent variables of study groups with the dependent variables of mean scores of HIF-1α, VEGF, and CD68
| Dependent variable | B | p-value | Beta coefficient | 95% CI |
|---|---|---|---|---|
| HIF-1 α | 6.934 | 0.002 | 0.478 | 2.754–11.113 |
| VEGF | 32.572 | 0.001 | 0.482 | 13.378–51.767 |
| CD68 | 10.499 | <0.001 | 0.792 | 7.583–13.416 |
B, B coefficient in logistic regression; CI, confidence interval; HIF-1α, hypoxia inducible factor 1 alpha; VEGF, vascular endothelial growth factor.
Age, sex, site, and study groups (healthy pulp, periapical granuloma, and radicular cyst) as the independent variables, p < 0.05 statistically significant.
Table 6.
Summary of main findings for HIF-1α, VEGF, and CD68 expression across study groups
- 1. Brizuela M, Bordoni B. Anatomy, head and neck, dental pulp [updated 2025 Dec 9]. In: StatPearls [Internet]. Treasure Island (FL): StatPearls Publishing; 2026 Jan [cited 2025 Jun 21]. Available from: https://www.ncbi.nlm.nih.gov/books/NBK537112/
- 2. Gopikrishna V. Grossman’s endodontic practice. 14th ed. New Delhi: Wolters Kluwer Health; 2021.
- 3. Huang HY, Wang WC, Lin PY, Huang CP, Chen CY, Chen YK. The roles of autophagy and hypoxia in human inflammatory periapical lesions. Int Endod J 2018;51 Suppl 2:e125-e145.ArticlePubMedPDF
- 4. Aranha AM, Zhang Z, Neiva KG, Costa CA, Hebling J, Nör JE. Hypoxia enhances the angiogenic potential of human dental pulp cells. J Endod 2010;36:1633-1637.ArticlePubMed
- 5. Bletsa A, Virtej A, Berggreen E. Vascular endothelial growth factors and receptors are up-regulated during development of apical periodontitis. J Endod 2012;38:628-635.ArticlePubMed
- 6. Nonaka CF, Maia AP, Nascimento GJ, de Almeida Freitas R, Batista de Souza L, Galvão HC. Immunoexpression of vascular endothelial growth factor in periapical granulomas, radicular cysts, and residual radicular cysts. Oral Surg Oral Med Oral Pathol Oral Radiol Endod 2008;106:896-902.ArticlePubMed
- 7. França GM, Carmo AFD, Costa Neto H, Andrade AL, Lima KC, Galvão HC. Macrophages subpopulations in chronic periapical lesions according to clinical and morphological aspects. Braz Oral Res 2019;33:e047.ArticlePubMed
- 8. Visarnta S, Ratisoontorn C, Panichuttra A, Sinpitaksakul P, Chantarangsu S, Dhanuthai K. Macrophage polarization in human periapical lesions in relation to histopathological diagnosis, clinical features and lesion volume: an ex vivo study. Int Endod J 2024;57:1829-1847.ArticlePubMed
- 9. Faul F, Erdfelder E, Lang AG, Buchner A. G*Power 3: a flexible statistical power analysis program for the social, behavioral, and biomedical sciences. Behav Res Methods 2007;39:175-191.ArticlePubMedPDF
- 10. Freitas TM, Miguel MC, Silveira EJ, Freitas RA, Galvão HC. Assessment of angiogenic markers in oral hemangiomas and pyogenic granulomas. Exp Mol Pathol 2005;79:79-85.ArticlePubMed
- 11. Leonardi R, Caltabiano M, Pagano M, Pezzuto V, Loreto C, Palestro G. Detection of vascular endothelial growth factor/ vascular permeability factor in periapical lesions. J Endod 2003;29:180-183.ArticlePubMed
- 12. Hirai K, Furusho H, Hirota K, Sasaki H. Activation of hypoxia-inducible factor 1 attenuates periapical inflammation and bone loss. Int J Oral Sci 2018;10:12.ArticlePubMedPMCPDF
- 13. He M, Bian Z. Expression of hypoxia-induced semaphorin 7A correlates with the severity of inflammation and osteoclastogenesis in experimentally induced periapical lesions. Arch Oral Biol 2017;75:114-119.ArticlePubMed
- 14. da Costa NM, de Siqueira AS, Ribeiro AL, da Silva Kataoka MS, Jaeger RG, de Alves-Júnior SM, et al. Role of HIF-1α and CASPASE-3 in cystogenesis of odontogenic cysts and tumors. Clin Oral Investig 2018;22:141-149.ArticlePubMedPDF
- 15. Alsaegh MA, Shetty SR, Mahmoud O, Varma SR, Altaie AM, Rawat SS. The expression of HIF-1α and VEGF in radicular cysts and periapical granulomas. Eur J Dent 2025;19:531-539.ArticlePubMed
- 16. Fonseca-Silva T, Santos CC, Alves LR, Dias LC, Brito M, De Paula AM, et al. Detection and quantification of mast cell, vascular endothelial growth factor, and microvessel density in human inflammatory periapical cysts and granulomas. Int Endod J 2012;45:859-864.ArticlePubMed
- 17. Azeredo SV, Brasil SC, Antunes H, Marques FV, Pires FR, Armada L. Distribution of macrophages and plasma cells in apical periodontitis and their relationship with clinical and image data. J Clin Exp Dent 2017;9:e1060-e1065.ArticlePubMedPMC
- 18. Bolan M, Lima DA, Figueiredo CP, Di Giunta G, Rocha MJ. Immunohistochemical study of presence of T cells, B cells, and macrophages in periradicular lesions of primary teeth. J Clin Pediatr Dent 2008;32:287-293.ArticlePubMedPDF
- 19. de Almeida NF, Brasil SC, Ferreira DC, Armada L. Aging effects in the expression of macrophages in post-treatment apical periodontitis lesions. Spec Care Dentist 2017;37:230-235.ArticlePubMedPDF
- 20. Rodini CO, Lara VS. Study of the expression of CD68+ macrophages and CD8+ T cells in human granulomas and periapical cysts. Oral Surg Oral Med Oral Pathol Oral Radiol Endod 2001;92:221-227.ArticlePubMed
- 21. Weber M, Schlittenbauer T, Moebius P, Büttner-Herold M, Ries J, Preidl R, et al. Macrophage polarization differs between apical granulomas, radicular cysts, and dentigerous cysts. Clin Oral Investig 2018;22:385-394.ArticlePubMedPDF
- 22. Bertasso AS, Léon JE, Silva RAB, Silva LA, de Queiroz AM, Pucinelli CM, et al. Immunophenotypic quantification of M1 and M2 macrophage polarization in radicular cysts of primary and permanent teeth. Int Endod J 2020;53:627-635.ArticlePubMedPDF
- 23. Agarwal M, Gupta C, Mohan KV, Upadhyay PK, Dhawan A, Jha V. Adjunctive intravitreal anti-vascular endothelial growth factor and moxifloxacin therapy in management of intraocular tubercular granulomas. Ocul Immunol Inflamm 2023;31:158-167.ArticlePubMed
REFERENCES
Tables & Figures
REFERENCES
Citations
Citations to this article as recorded by 
 ePub Link
 Cite
CiteInterplay of hypoxia, angiogenesis, and macrophages in pulp and periapical lesions: an immunohistochemical cross-sectional study


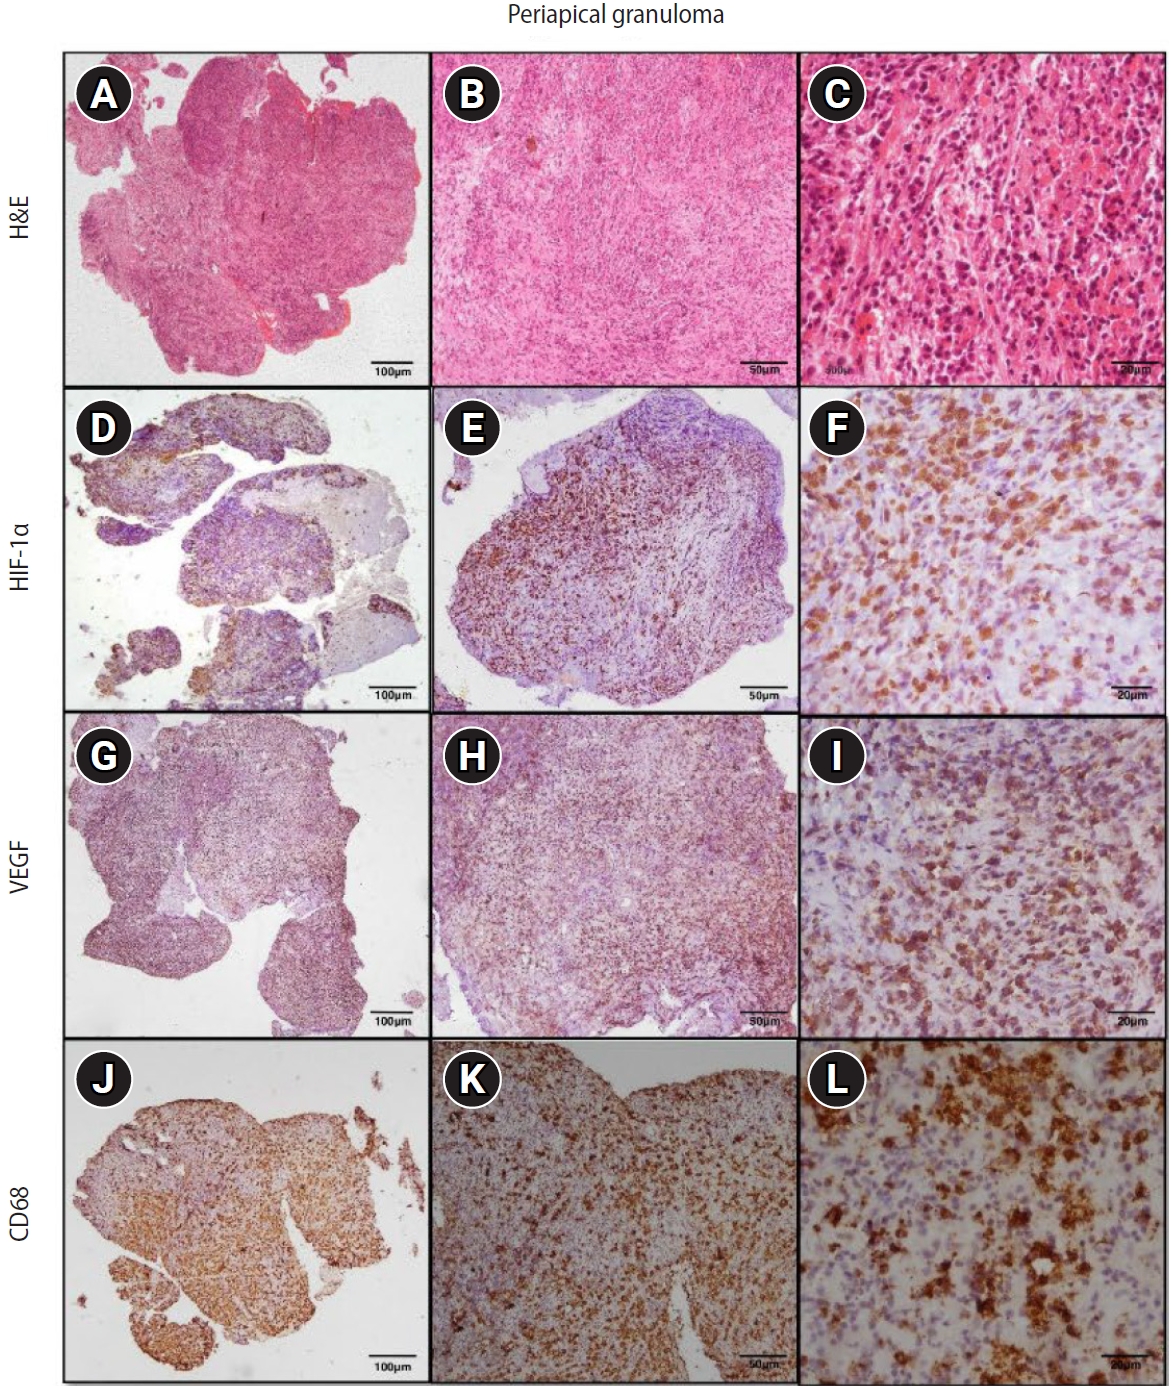


Figure 1. Flow chart depicting the inclusion and exclusion criteria of cases for participation eligibility.
Figure 2. Intraoral periapical radiograph (IOPA) of periapical lesions. (A, B) IOPA of periapical granuloma cases showing well-defined radiolucency with respect to the maxillary right lateral incisor and mandibular right lateral incisor (arrows). (C, D) IOPA of radicular cyst cases showing well-defined radiolucency associated with the root apices of the maxillary left central incisor and mandibular right canine (arrows).
Figure 3. Hematoxylin and eosin (H&E) and immunoexpression of hypoxia-inducible factor 1 alpha (HIF-1α), vascular endothelial growth factor (VEGF), and CD68 in periapical granuloma. (A–C) Periapical granuloma showing fibrocellular connective tissue stroma infiltrated by intense macrophage-rich inflammatory infiltrate. (D–F) Diffuse immunoexpression of HIF-1α in inflammatory cells, endothelial cells, and fibroblasts of periapical granuloma. (G–I) Diffuse immunoexpression of VEGF in blood vessels, inflammatory infiltrate, and stromal cells (fibroblasts) of periapical granuloma. (J–L) Immunoexpression of CD68 in lysosomal granules and the surface of macrophages of periapical granuloma. A–C: H&E staining. D–F: immunohistochemistry (IHC), anti-HIF-1α. G–I: IHC, anti-VEGF. J–L: IHC, anti-CD68. Images were obtained at ×40, ×100, and ×400 magnifications (scale bars: 100, 50, and 20 μm, respectively).
Figure 4. Hematoxylin and eosin (H&E) and immunoexpression of hypoxia-inducible factor 1 alpha (HIF-1α), vascular endothelial growth factor (VEGF), and CD68 in radicular cyst. (A–C) Radicular cyst showing hyperplastic stratified squamous epithelium with an arcading pattern and supporting connective tissue capsule. (D–F) Diffuse immunoexpression of HIF-1α in inflammatory cells, connective tissue, and epithelial lining of radicular cyst. (G–I) Diffuse immunoexpression of VEGF in blood vessels, inflammatory infiltrate, stromal cells (fibroblasts), and epithelial lining of radicular cyst. (J–L) Immunoexpression of CD68 in lysosomal granules and the surface of macrophages of radicular cyst. A–C: H&E staining. D–F: immunohistochemistry (IHC), anti-HIF-1α. G–I: IHC, anti-VEGF. J–L: IHC, anti-CD68. Images were obtained at ×40, ×100, and ×400 magnifications (scale bars: 100, 50, and 20 μm, respectively).
Figure 5. Hematoxylin and eosin (H&E) and immunoexpression of hypoxia-inducible factor 1 alpha (HIF-1α), vascular endothelial growth factor (VEGF), and CD68 in healthy pulp. (A–C) Healthy pulp showing connective tissue stroma with fibroblasts and vascular channels. (D–F) Diffuse immunoexpression of HIF-1α in fibroblasts and endothelial cells. (G–I) Diffuse immunoexpression of VEGF in blood vessels and stromal cells (fibroblasts) of healthy pulp. (J–L) Immunoexpression of CD68 in lysosomal granules and surface of macrophages of healthy pulp. A–C: H&E staining. D–F: immunohistochemistry (IHC), anti-HIF-1α. G–I: IHC, anti-VEGF. J–L: IHC, anti-CD68. Images were obtained at ×40, ×100, and ×400 magnifications (scale bars: 100, 50, and 20 μm, respectively).
Figure 1.
Figure 2.
Figure 3.
Figure 4.
Figure 5.
Interplay of hypoxia, angiogenesis, and macrophages in pulp and periapical lesions: an immunohistochemical cross-sectional study
| Serial No. | Study population | Age (yr) | Sex | Site |
|---|---|---|---|---|
| Healthy pulp | ||||
| 1 | PT-3 | 32 | Female | Mandibular right third molar |
| 2 | PT-6 | 28 | Female | Mandibular left third molar |
| 3 | PT-7 | 30 | Female | Mandibular right third molar |
| 4 | PT-10 | 36 | Male | Maxillary left third molar |
| 5 | PT-12 | 35 | Male | Maxillary right third molar |
| 6 | PT-16 | 40 | Female | Maxillary right third molar |
| 7 | PT-17 | 31 | Male | Maxillary left third molar |
| 8 | PT-18 | 29 | Male | Mandibular right third molar |
| 9 | PT-20 | 38 | Male | Mandibular right third molar |
| 10 | PT-23 | 27 | Male | Mandibular left third molar |
| 11 | PT-24 | 26 | Male | Maxillary right third molar |
| 12 | PT-25 | 30 | Male | Maxillary left third molar |
| 13 | PT-26 | 32 | Female | Maxillary left third molar |
| 14 | PT-27 | 33 | Female | Maxillary right third molar |
| 15 | PT-28 | 37 | Male | Maxillary right third molar |
| 16 | PT-29 | 33 | Male | Mandibular left third molar |
| 17 | PT-30 | 28 | Female | Mandibular right third molar |
| Periapical granuloma | ||||
| 1 | 535/21 | 19 | Male | Mandibular left lateral incisor to mandibular right lateral incisor |
| 2 | 175/22 | 54 | Male | Maxillary right first premolar |
| 3 | 263/22 | 18 | Female | Maxillary right central incisor |
| 4 | 281/23 | 69 | Male | Mandibular right lateral incisor |
| 5 | 285/23 | 23 | Male | Maxillary right and left central incisors |
| 6 | 313/23 | 24 | Male | Maxillary right and left central incisors |
| 7 | 314/23 | 20 | Male | Mandibular right central incisor |
| 8 | 324/23 | 20 | Male | Maxillary left central incisor |
| 9 | 329/23 | 26 | Male | Mandibular right and left central incisors |
| 10 | 345/23 | 20 | Male | Maxillary left central incisor |
| 11 | 374/23 | 40 | Male | Maxillary right and left central incisors |
| 12 | 441/23 | 18 | Male | Maxillary left central incisor |
| 13 | 451/23 | 25 | Male | Maxillary right and left central incisors |
| 14 | 452/23 | 29 | Female | Maxillary right and left central incisors |
| 15 | 473/23 | 30 | Female | Maxillary right central and lateral incisors |
| 16 | 480/23 | 25 | Male | Maxillary right first molar |
| 17 | 85/24 | 58 | Female | Maxillary left lateral incisor |
| Radicular cyst | ||||
| 1 | 552/21 | 41 | Male | Maxillary left lateral incisor |
| 2 | 322/21 | 47 | Female | Mandibular right second molar |
| 3 | 367/21 | 24 | Female | Mandibular left first premolar to mandibular right first premolar |
| 4 | 466/21 | 58 | Female | Maxillary right central incisor |
| 5 | 467/21 | 26 | Female | Mandibular right second premolar to mandibular right second molar |
| 6 | 124/22 | 51 | Male | Maxillary right central incisor to maxillary right canine |
| 7 | 172/22 | 36 | Female | Maxillary right and left central incisors |
| 8 | 377/22 | 17 | Male | Maxillary right lateral incisor to maxillary left central incisor |
| 9 | 71/23 | 21 | Male | Maxillary left central incisor |
| 10 | 254/23 | 33 | Male | Maxillary right central incisor to maxillary right second premolar |
| 11 | 337/23 | 55 | Male | Maxillary left second premolar to maxillary left second molar |
| 12 | 426/23 | 54 | Female | Maxillary left central incisor |
| 13 | 438/23 | 39 | Female | Maxillary right and left central incisors |
| 14 | 442/23 | 20 | Female | Maxillary left central incisor to maxillary left lateral incisor |
| 15 | 95/24 | 22 | Female | Maxillary right lateral incisor |
| 16 | 109/24 | 30 | Female | Maxillary right central incisor |
| 17 | 245/24 | 37 | Male | Maxillary right central incisor |
| Parameters | Healthy pulp | Periapical granuloma | Radicular cyst | p-value |
|---|---|---|---|---|
| HIF-1α | 10.17 ± 9.01 | 25.76 ± 9.08 | 24.65 ± 9.91 | <0.001 |
| VEGF | 28.04 ± 23.71 | 88.56 ± 61.69 | 94.51 ± 49.69 | <0.001 |
| CD68 | 4.16 ± 3.12 | 16.71 ± 7.38 | 23.47 ± 10.25 | <0.001 |
| Group | p-value | ||
|---|---|---|---|
| HIF-1α expression | VEGF expression | CD68 expression | |
| Healthy pulp and periapical granuloma | <0.001 |
<0.001 |
<0.001 |
| Periapical granuloma and radicular cyst | 0.865 | 0.454 | 0.018 |
| Healthy pulp and radicular cyst | <0.001 |
<0.001 |
<0.001 |
| Groups | HIF-1α and VEGF | HIF-1α and CD68 | VEGF and CD68 | |||
|---|---|---|---|---|---|---|
| r | p-value | r | p-value | r | p-value | |
| Healthy pulp | –0.028 | 0.916 | –0.046 | 0.860 | 0.630 | 0.007 |
| Periapical granuloma | –0.169 | 0.516 | 0.324 | 0.205 | 0.532 | 0.028 |
| Radicular cyst | 0.275 | 0.286 | 0.162 | 0.535 | 0.211 | 0.417 |
| Dependent variable | B | p-value | Beta coefficient | 95% CI |
|---|---|---|---|---|
| HIF-1 α | 6.934 | 0.002 | 0.478 | 2.754–11.113 |
| VEGF | 32.572 | 0.001 | 0.482 | 13.378–51.767 |
| CD68 | 10.499 | <0.001 | 0.792 | 7.583–13.416 |
| Parameter | Healthy pulp (HP) | Periapical granuloma (PG) | Radicular cyst (RC) | Statistical significance |
|---|---|---|---|---|
| HIF-1α expression | Weak staining, limited to fibroblasts and endothelial cells | Strong cytoplasmic + intense nuclear staining | Strong staining in inflammatory cells, fibroblasts, endothelial cells, and all epithelial layers | Significant difference across groups (p < 0.001) |
| Prominent in inflammatory cells, endothelial cells, and fibroblasts | PG and RC > HP (p < 0.001) | |||
| PG vs RC, not significant (p = 0.865) | ||||
| VEGF expression | Cytoplasmic positivity in vascular, inflammatory and stromal cells | Strong cytoplasmic staining in connective tissue; higher than HP | Highest expression overall; strong epithelial positivity (58.8% cases) | Significant overall (p < 0.001) |
| PG and RC > HP (p < 0.001) | ||||
| PG vs RC, not significant (p = 0.454) | ||||
| CD68 (macrophages) | Lower macrophage density | Moderate macrophage presence, mainly in the middle connective tissue | Highest macrophage presence, especially subepithelial | Significant overall (p < 0.001) |
| PG and RC > HP | ||||
| RC > PG (p = 0.018) | ||||
| Correlation analysis | HIF-1α vs VEGF and CD68: nonsignificant | HIF-1α correlations are nonsignificant | Correlations between all markers are nonsignificant | – |
| VEGF vs CD68: significant (r = 0.630, p = 0.007) | VEGF vs CD68: significant (r = 0.532, p = 0.028) | |||
| Regression analysis | – | – | – | Age, sex, site: nonsignificant |
| Study group remained significantly associated with mean marker expression |
Table 1. Demographic characteristics and lesion site distribution of the study population
PT, pulp tissue.
Table 2. Mean expression score of HIF-1α, VEGF, and macrophages (CD68) in healthy pulp, periapical granuloma, and radicular cyst
Values are presented as mean ± standard deviation. HIF-1α, hypoxia inducible factor 1 alpha; VEGF, vascular endothelial growth factor. Kruskal-Wallis test.
Table 3. Intergroup comparison of HIF-1α, VEGF, and macrophages (CD68) in healthy pulp, periapical granuloma, and radicular cyst
HIF-1α, hypoxia inducible factor 1 alpha; VEGF, vascular endothelial growth factor.
Table 4. Intragroup correlation of HIF-1α, VEGF, and CD68 expressions in healthy pulp, periapical granuloma, and radicular cyst
HIF-1α, hypoxia inducible factor 1 alpha; VEGF, vascular endothelial growth factor. r, Spearman’s rho correlation coefficient.
Table 5. Multiple linear regression analysis on the association of the independent variables of study groups with the dependent variables of mean scores of HIF-1α, VEGF, and CD68
B, B coefficient in logistic regression; CI, confidence interval; HIF-1α, hypoxia inducible factor 1 alpha; VEGF, vascular endothelial growth factor. Age, sex, site, and study groups (healthy pulp, periapical granuloma, and radicular cyst) as the independent variables,
Table 6. Summary of main findings for HIF-1α, VEGF, and CD68 expression across study groups
HIF-1α, hypoxia-inducible factor 1 alpha; VEGF, vascular endothelial growth factor.

