
Articles
- Page Path
- HOME > Restor Dent Endod > Volume 50(3); 2025 > Article
- Research Article Comparison of YouTube, TikTok, and Instagram as digital sources for obtaining information about pulp therapy in primary and permanent teeth
-
Hüseyin Gürkan Güneç1,*
 , Emine Kaya2, Dila Nur Okumuş1, Merve Gül Erence2
 -
Restor Dent Endod 2025;50(3):e26.
DOI: https://doi.org/10.5395/rde.2025.50.e26
Published online: July 24, 2025
1Department of Endodontics, Hamidiye Dental Faculty, Health Sciences University, Istanbul, Türkiye
2Department of Pediatric Dentistry, Hamidiye Dental Faculty, Health Sciences University, Istanbul, Türkiye
- *Correspondence to Hüseyin Gürkan Güneç, DDS, Ph.D Department of Endodontics, Hamidiye Dental Faculty, Health Sciences University, Selimiye, Tıbbiye Cd, 34668 Üsküdar/Istanbul, Türkiye Email: gunec.gurkan@gmail.com
• Received: March 16, 2025 • Revised: April 2, 2025 • Accepted: April 7, 2025
© 2025 The Korean Academy of Conservative Dentistry
This is an Open-Access article distributed under the terms of the Creative Commons Attribution Non-Commercial License (http://creativecommons.org/licenses/by-nc/4.0) which permits unrestricted non-commercial use, distribution, and reproduction in any medium, provided the original work is properly cited.
Abstract
-
Objectives This study aimed to compare the content, educational quality, and dependability of videos on Instagram, TikTok, and YouTube about pulp therapy (PT) in pediatric dentistry and endodontics.
-
Methods Three popular video sites, Instagram (Meta Platforms, Inc.,), TikTok (ByteDance Ltd.), and YouTube (Google LLC), were searched for PT content to analyze for compliance with the American Association of Endodontists and American Academy of Pediatric Dentistry guidelines for clinical endodontists and pediatric dentists. The searched hashtags were #pulpaltherapy, #pulpaltreatment, #pulptherapy, and #pulptreatment. The classification of 158 English-language videos was based on several variables: communication quality, duration, likes and dislikes, views, source, treatment, and genre. The videos were evaluated using a usefulness score and the Global Quality Scale (GQS), Video Information and Quality Index (VIQI), Journal of the American Medical Association (JAMA) score, and modified DISCERN score to rate their quality and reliability. The majority of the videos were published by healthcare professionals, dental clinics, and universities.
-
Results Significant relationships existed between video length, source of upload, usefulness score, tooth type, pulp status, and VIQI, JAMA, GQS, and DISCERN scores for all three platforms (p < 0.05). A statistically significant relationship existed of YouTube, TikTok, and Instagram with the number of views, number of months since upload, view rates, comments and likes (p < 0.05).
-
Conclusions TikTok and Instagram reel videos provided high- to moderate-quality information about PT, especially in children, but YouTube may provide more reliable information than other social media tools.
INTRODUCTION
Pulp therapy (PT) aims to preserve the health and integrity of teeth, along with their supporting tissues, in cases of caries, traumatic injury, or other underlying factors affecting a tooth. Various therapeutic interventions are involved in PT depending on the diagnosis of pulp health or pathology for both primary and permanent teeth [1]. Properly performed PT at the right time prevents potential problems arising from tooth loss by enabling the tooth to remain in the dental arch. The successful implementation of PT is directly associated with the clinician’s clinical experience and theoretical knowledge [2]. Dental professionals are also responsible for providing accurate information to their patients. However, medical information sources are rapidly changing for both patients and healthcare professionals [3].
During the coronavirus disease 2019 (COVID-19) pandemic, social media has become an increasingly widespread method for people to obtain medical information [4]. To prevent the spread of the novel coronavirus, the suspension of practical applications and face-to-face education, particularly in the field of dentistry, has directed students towards completing their medical education through the use of internet platforms [5]. To obtain medical information, dental and medical professionals often rely on a range of educational methods, with social media platforms such as Wikipedia (Wikimedia Foundation, San Francisco, CA, USA), YouTube (Google LLC, Mountain View, CA, USA), and Facebook (Meta Platforms, Inc., Menlo Park, CA, USA) being among the most prominent [6].
YouTube, the second most-visited online platform, has been recognized as a highly effective way of disseminating crucial health-related information to communities, providing valuable access to such information for both healthcare professionals and individuals [7]. However, information on YouTube may not always be scientifically accurate, and some misleading information might have adverse effects on patients’ health [8]. Recently, TikTok (ByteDance Ltd., Beijing, China) has emerged as a popular platform like YouTube for the dissemination of personal or health-related experiences. Owing to its low cost, widespread popularity, and increasing adoption by healthcare professionals, TikTok serves as an accessible platform for individuals seeking medical advice. This has led to increasing interest in studies examining the quality of videos on TikTok [9]. Since its inception in 2010, Instagram (Meta Platforms, Inc., Menlo Park, CA, USA) has experienced particularly remarkable growth, emerging as one of the most popular social media platforms. Instagram is becoming a popular platform for marketing, advertising, activism, and news updates across a range of businesses, including higher education [10].
A significant body of research has analyzed the content of medical and dental information videos on YouTube [7,8,10,11], whereas studies related to TikTok [3,9,12], and Instagram are limited [13]. To date, no study has comprehensively analyzed the quality of YouTube, TikTok, and Instagram videos related to PT. The primary objective of this study was to evaluate the reliability, quality, and content of PT-related videos across these three platforms and to compare them with one another.
METHODS
The data used in this study were freely accessible and did not include clinical or animal experimentation data, including specifics, photos, or patient questionnaires. Consequently, neither informed consent nor clearance from the ethics committee was required. This study is a comparison and analysis of the videos uploaded on social media platforms like YouTube, TikTok, and Instagram; therefore, we do not have any human participants, a clinical trial number, or ethical approval.
A cross-sectional study design was employed to assess the educational value of videos available on YouTube, TikTok, and Instagram. To identify the most frequently used search terms, the Google Trends platform (Google LLC; https://trends.google.com) was utilized [14]. In this study, the search parameters were set to “worldwide” and limited to data from the past 5 years. Possible hashtags related to children’s oral health, such as #pulptherapy, #pulptreatment, #pulpaltherapy, and #pulpaltreatment were used in three video platform searches conducted between 7:00 am and 9:00 pm on March 11 to 12, 2024 (Figure 1).
Videos relevant to PT were found using the unfiltered default settings. After manually reviewing the first 361 PT-related videos on YouTube, 275 on TikTok, and 224 on Instagram, relevant information was extracted, documented, and scored using Microsoft Excel (Microsoft Corp., Redmond, WA, USA). All pop-ups and historical data in the browser history were deleted before the hashtag search was performed. The top 158 videos were reviewed for relevance for all video platforms (Figure 2).
Initial scanning of all videos (860 videos) was performed by two experienced specialists (HGG and EK) (Figure 3). Then, two researchers (MGE and DNO) evaluated the videos independently. Among the researchers, two were PhD students and the other two were specialists with 10 years of experience in endodontics and pediatric dentistry; all of them possessed profound expertise in pulpal treatment, pulp capping, pulpectomy, apexification, apexogenesis, and regenerative endodontics.
Videos unrelated to PT, duplicates, those lacking audio, narration, or graphics, non-English content, incomprehensible speech, or those outside the specified duration limits were excluded (Figure 2). Each video was meticulously analyzed to gather information on views, likes, dislikes, comments, duration (in seconds), time since upload, country of origin (Figure 4), upload source, video category, and gender of the uploader. To mitigate bias, counts for likes, dislikes, and comments were conducted (by MGE and DNO) subsequent to viewing each video. Viewer engagement metrics were assessed using the interactive index (as the difference between likes and dislikes divided by total views, multiplied by 100) and view rate (determined by dividing views by months since upload, multiplied by 100).
Uploaders were categorized under five headings: (1) healthcare professionals (endodontist, pediatric dentist, dentist), (2) hospitals, universities, and dental clinics, (3) commercial (dental manufacturing or supply companies), (4) laypersons, and (5) others (television channels or news agencies) [15]. Video types were recorded in four groups: (1) educational, (2) patient testimonial (reference), (3) product advertising, and (4) entertainment [16]. The videos were also grouped by length: 0–15 seconds, 15–30 seconds, 30–45 seconds, and >45 seconds [17].
After reviewing the relevant literature, we identified the fundamental aspects of PT [18–20]. Subsequently, we conducted an analysis of videos on YouTube, TikTok, and Instagram to delineate the content topics addressed, such as (1) definition of PT in permanent and primary teeth, (2) indications of PT, (3) contraindications of PT, (4) objectives, (5) required materials and equipment, (6) benefits and drawbacks, (7) radiographic evaluation, (8) procedure steps, (9) bleeding control, (10) use of rubber dams, (11) cavity disinfection, (12) restorability of the tooth, (13) possible complications, (14) pain and symptoms that may occur after treatment, and (15) alternative treatments. Each of these 15 items contributed 1 point to the total content score, yielding a maximum possible score of 15. Content scores were categorized as low (0–5 points), medium (6–10 points), or high (11–15 points).
Additionally, videos were stratified into three groups according to communication quality. Group 1 included videos without complementary images; Group 2 included videos with minimal complementary images (e.g., a single image); and Group 3 included videos with extensive use of complementary images (e.g., moving images or multiple images) [17].
Evaluation of videos regarding quality and reliability, four scoring systems: the modified DISCERN tool, the Global Quality Scale (GQS), the Video Information and Quality Index (VIQI), and the Journal of American Medical Association (JAMA) score were used. To assess the quality and reliability of written health information regarding treatment options, the DISCERN toolkit (http://www.discern.org.uk/discern_instrument.php) was utilized. This standardized instrument comprises 15 questions, each rated on a scale from 1 (poor) to 5 (excellent) [21].
The GQS is a 5-point ordinal scale that evaluates the quality of information provided by the analyzed videos based on accessibility, relevance to patients, and overall caliber. The scale comprises five questions, each corresponding to a different quality level: very poor quality (1 point), somewhat poor quality with limited utility (2 points), average quality (3 points), satisfactory quality (4 points), and outstanding quality (5 points) [22].
The VIQI employs a 5-point Likert scale to assess both the quality and content of videos, with higher scores indicating superior quality. Each video was evaluated based on information flow, accuracy, and overall quality. Additionally, the presence of features such as still images, animations, community interviews, video covers, and report summaries contributed 1 point each to the overall score. Accuracy was specifically determined by examining the consistency between the video’s title and its actual content [23].
Data collected from the videos were assessed using JAMA scores, which encompass four criteria: authorship, citation, description, and currency. Each criterion is rated on a scale from 0 to 4, where a score of 0 indicates that the material fails to meet the specified criteria, while a score of ≥1 indicates compliance. Higher scores indicate greater information quality [24].
This study provided descriptive statistics (count, percentage, mean, standard deviation, and median). The assumption of normal distribution was checked using the Shapiro-Wilk test. For comparisons between two groups with non-normally distributed data, the Mann-Whitney U test was applied. For comparisons among three or more groups with non-normally distributed data, the Kruskal-Wallis test was conducted to compare group means. The post hoc Bonferroni test was used to identify which group or groups were responsible for any observed differences. When the assumption of sample size (expected value, >5) for testing the relationship between categorical variables was not met, the Fisher exact test was performed. The relationships between continuous variables were examined using the Spearman correlation, and the relationships between a continuous variable and an ordinal categorical variable were examined using the Kendall tau correlation. The analyses were conducted using IBM SPSS version 25.0 (IBM Corp, Armonk, NY, USA).
RESULTS
The correlation coefficients (Cohen’s Kappa) between the initial and repeat measurement values exceeded the threshold of 0.70 (YouTube, 0.904–0.996; TikTok, 0.791–0.975; and Instagram, 0.856–0.973). Since the p-values were less than the alpha value of 0.05, statistically significant, positive, and very high-level relationships were obtained. Therefore, the measurements were stable and consistent. The videos obtained for the study could not be used because some did not meet the requirements: 17.5% of YouTube videos were used, along with 10.2% of TikTok videos and 45.3% of Instagram videos.
As a result of the analyses, statistically significant relationships were identified between social media type and video length; source; VIQI, JAMA, and GQS scores; DISCERN section 1; tooth type; pulp status; and usefulness score (p < 0.05). No statistically significant relationship existed between social media type and video type (p > 0.05) (Table 1).
Statistically significant differences were found among social media types for the number of views, number of months since upload, number of comments, number of likes, viewing rate, usefulness score, DISCERN section 2, and total DISCERN scores (p < 0.05). For the number of views, number of comments, and number of likes, statistically significant differences were identified between Instagram and YouTube and between Instagram and TikTok (p < 0.05). The number of views, comments, and likes on YouTube and TikTok was higher than for Instagram. No statistically significant difference was found in DISCERN section 1 scores according to the type of social media (p > 0.05) (Table 2).
The distribution and comparison of video characteristics according to VIQI scores are shown in Table 3. For YouTube, Instagram, and TikTok, statistically significant differences were found in usefulness, DISCERN section 1, and total DISCERN scores based on VIQI scores (p < 0.05).
A comparison of video characteristics according to JAMA scores is presented in Table 4. Statistically significant differences were observed among usefulness, DISCERN section 1, DISCERN section 2, and total DISCERN scores according to JAMA scores in YouTube and TikTok videos (p < 0.05). For Instagram videos, statistically significant differences were found among the number of days since upload, usefulness, DISCERN section 1, and total DISCERN scores according to JAMA scores (p < 0.05).
Table 5 presents the distribution and comparison of video characteristics according to GQS scores. In YouTube, TikTok, and Instagram videos, statistically significant differences were observed among usefulness, DISCERN section 1, DISCERN section 2, and total DISCERN scores based on GQS scores (p < 0.05). Table 6 shows the distribution and comparison of video characteristics according to the usefulness score. The analysis revealed statistically significant differences among DISCERN section 1, DISCERN section 2, and total DISCERN scores of only YouTube videos according to usefulness scores (p < 0.05).
DISCUSSION
PT is performed often in dental offices, dental clinics, and university hospitals on both adult and pediatric patients, with an estimated prevalence of 9.6%, though many cases go unreported [25,26]. During childhood, determining and selecting appropriate treatment options for PT in both permanent and primary teeth can pose challenges, particularly when evaluating the extent and location of tooth decay [27]. Treatment success generally depends on the correct evaluation of clinical and radiological findings. Therefore, condition management and appropriate treatment plans commonly provided by international guidelines are important for a better prognosis [20].
Social media has become an increasingly widespread source of information. It can also be preferred as a source of health content due to its ease of use, speed, and significant impact on society [28]. During the COVID-19 pandemic, many dental schools quickly adapted to online and virtual learning platforms to ensure students could continue their education. This shift was necessary due to curfews, social distancing, and the closure of many face-to-face academic and clinical settings. While these tools were crucial to ensure continuity of education, they were challenging for many students, especially for the practical skills required in dentistry [29,30]. Although audiovisual content has a powerful emotional and psychological effect, social media online video streaming services can be helpful in distance education [31]. Many educational videos can be found on YouTube, TikTok, and Instagram; however, some of them might contain inaccurate or out-of-date material because of variations in diagnosis and treatment methods [32,33]. No study has analyzed the quality of PT-related content on these three platforms together. Therefore, this article serves as a warning regarding the quality, accuracy, and reliability of information about PT disseminated on these platforms. We hypothesized that these videos tend to be unreliable and inaccurate and have poor educational quality due to their limited value.
Although numerous articles have explored YouTube content in a variety of dentistry- and medicine-related themes, few have examined TikTok and Instagram. Many studies exist in different fields of pediatric dentistry and endodontics addressing the YouTube platform [5,7,34], but only one has focused on the usefulness of videos on vital PT in endodontics, and no study exists on PT in pediatric dentistry [35]. Similarly, when the literature on both Instagram and TikTok videos is reviewed, very few studies exist on general and specialist dentistry topics [3,9,10], but one study has addressed these two social media platforms in pediatric dentistry [36]. Therefore, this study aimed to comprehensively evaluate videos on YouTube, TikTok, and Instagram by analyzing their content, quality, and reliability based on scores and statistical scales adapted from previous similar studies [3,9,34].
Video quality can be evaluated based on content topics; however, this approach may influence the data collected. Our literature review revealed that previous studies have employed varying methods for selecting content topics, frequently utilizing questionnaires. In line with several other studies, we chose the closed-group discussion method to determine the content topics. Consultation was exclusively sought from qualified and experienced specialists in PT and dentistry active on social media platforms. Based on the recommendations of the American Association of Endodontists and the American Academy of Pediatric Dentistry, our research team conducted a comprehensive analysis of thematic elements and identified 15 topics [1,18,19].
PT-related YouTube, TikTok, and Instagram videos were evaluated in terms of usefulness, coverage, content, views, and likes in this study. The videos were assessed using the GQS, DISCERN, JAMA, and VIQI scales, commonly applied in previous research [21]. DISCERN plays a vital role in ensuring patient access to reliable healthcare information, enabling informed treatment decisions. VIQI assesses video content and information quality, while JAMA scores evaluate authorship, citation, annotation, and timeliness. GQS measures the quality, usability, and educational value of videos. Consistent with previous studies [37–39], GQS and DISCERN scores were used due to their reliability, while VIQI and JAMA further contributed to a comprehensive assessment [35,40]. Using all four scales in a single study enhances the depth of analysis.
YouTube, TikTok, and Instagram have distinct characteristics regarding content length, user demographics, and algorithmic structures [41]. Previous research in orthodontics [42] found similarities in video durations on YouTube and TikTok, whereas Bengi et al. [3] reported significant differences, with YouTube videos being significantly longer. Consistent with Bengi et al. [3], our study found YouTube videos to be nearly eight times longer than TikTok videos (p > 0.001). Most YouTube videos exceeded 45 seconds, while TikTok and Instagram videos ranged from 30 to 45 seconds due to platform limitations.
More accurate information can be obtained from sources such as healthcare professionals, hospitals, and academic institutions [3]. Paksoy et al. [9] reported that most of the videos regarding implant treatment on YouTube and TikTok were uploaded by healthcare professionals. Similarly, we found that most of the videos related to PT on YouTube (61.9%), TikTok (82.1%), and Instagram (75.8%) were uploaded by healthcare professionals (p = 0.006). Although it was not statistically significant, most of the videos were educational on all the social media platforms. Bengi et al. [3] reported that despite no statistically significant difference in usefulness score by the source of upload for YouTube videos, healthcare professionals uploaded statistically significantly more useful videos on TikTok. In the present study, the usefulness score on YouTube was higher than for Instagram or TikTok. Usefulness scores showed statistically significant differences between YouTube and Instagram and between YouTube and TikTok (p < 0.05).
Videos with rich content received more engagement in terms of likes, dislikes, and views compared to those with limited information (p < 0.05). This aligns with the expectation that high-quality content reaches a broader audience and ranks higher in search results. Additionally, content-rich videos garnered more appreciation from viewers. Many individuals rely on YouTube, TikTok, and Instagram for PT-related information. Patients share experiences to guide others in considering the procedure. McLean et al. [43] found that YouTube videos on root canal treatment received substantial engagement, with an average of 2,211 comments, 4,532.50 likes, and 1,037,189.10 views. Similarly, Bengi et al. [3] reported that YouTube videos on gingival enlargement had significantly higher engagement than TikTok videos. In our study, YouTube and TikTok videos had higher view, comment, and like counts than Instagram videos, indicating that these platforms reach a wider audience. Statistically significant differences in view rates were observed between TikTok and Instagram and between TikTok and YouTube (p < 0.05), with TikTok having the highest view rate.
Significant positive correlations were found between VIQI scores and usefulness, as well as DISCERN 1 and total DISCERN scores across all platforms (p < 0.05). This suggests that improving video information quality enhances reliability and patient utility, consistent with previous studies [35,44]. However, no significant association was observed between VIQI scores and DISCERN 2 scores on Instagram. JAMA criteria showed no significant correlation with any evaluation metric, aligning with Jung and Seo [45]. For Instagram videos, significant differences were found in JAMA scores based on the number of months since upload (p < 0.05). The majority of videos—73.1% on YouTube, 99% on TikTok, and 99% on Instagram—received low JAMA scores, indicating poor academic quality.
The correlation between video strength and usefulness, DISCERN sections 1 and 2, and total DISCERN scores was statistically significant and positive across YouTube, TikTok, and Instagram (p < 0.05). YouTube videos received the highest DISCERN and GQS scores, consistent with previous studies [46]. In line with Kılınç [42], who reported high-quality YouTube videos, our study found that YouTube content had superior educational value. Higher usefulness scores correlated with higher DISCERN measurements, further supporting the credibility of YouTube videos over other platforms.
This study has several limitations. First, its cross-sectional design and the analysis of only a subset of the available data may restrict the generalizability of the findings. Additionally, YouTube, TikTok, and Instagram are dynamic platforms, with search results varying over time due to changes in algorithms and user activity. Although we employed the most commonly used search terms, alterations to these terms or the timing of the search could yield different results. Consequently, many videos containing rich and relevant content may have been excluded. Furthermore, the study was restricted to English-language videos, limiting its applicability to non-English content.
CONCLUSIONS
The most notable finding of this study was that YouTube videos demonstrated greater reliability and accuracy compared to TikTok and Instagram, particularly regarding pulpotomy (PT) in both primary and permanent teeth. While the available content was generally useful for treatment-related information, there was a noticeable deficiency in topics related to etiology and prognosis. To address this gap, healthcare professionals should focus on creating high-quality, evidence-based educational content that covers not only treatment procedures but also underlying causes and long-term outcomes. YouTube should remain the primary platform for disseminating such content due to its higher reliability, but efforts to improve content quality on TikTok and Instagram should also be considered to reach a broader audience, including patients and general practitioners.
-
CONFLICT OF INTEREST
No potential conflict of interest relevant to this article was reported.
-
FUNDING/SUPPORT
The authors have no financial relationships relevant to this article to disclose.
-
AUTHOR CONTRIBUTIONS
Conceptualization, Methodology, Project administration, Validation: Güneç HG. Data curation: Okumuş DN, Erence MG. Formal analysis: Kaya E, Erence MG. Investigation: Güneç HG, Okumuş DN, Erence MG. Resources, Supervision, Visualization: Kaya E. Software: Erence MG. Writing - original draft: Güneç HG. Writing - review & editing: Kaya E. All authors read and approved the final manuscript.
-
DATA SHARING STATEMENT
The data used in this study are publicly available and do not involve any medical materials, images, or questionnaires. Data supporting the findings of this study are available at https://www.YouTube.com/, https://www.tiktok.com/ and https://www.instagram.com/ and in references [1–46].

Figure 2.

Flow diagram of the data detected from the video platforms. YouTube: Google LLC, Mountain View, CA, USA. TikTok: ByteDance Ltd., Beijing, China. Instagram: Meta Platforms, Inc., Menlo Park, CA, USA.
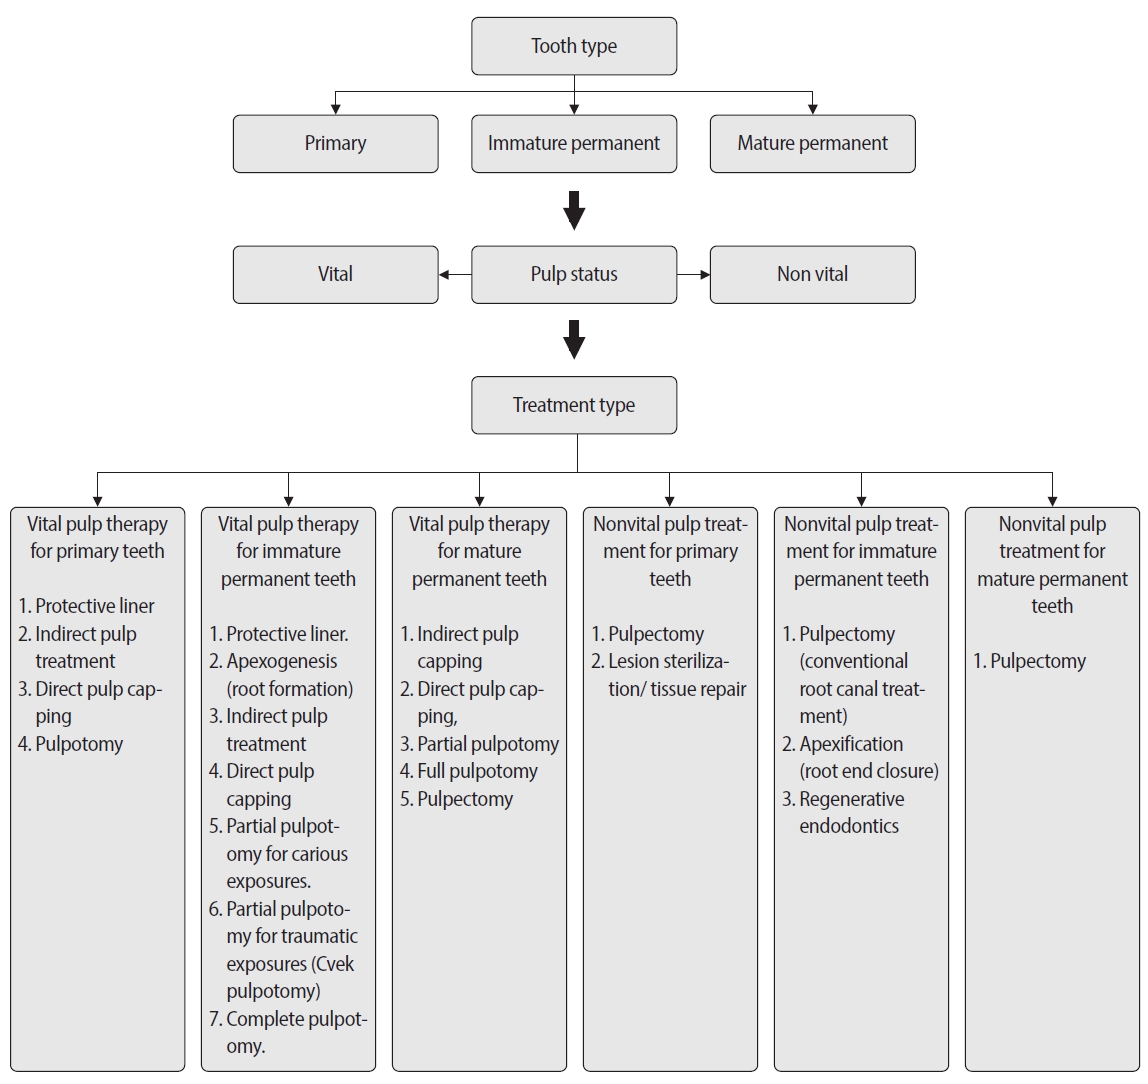

Table 1.
Distribution and comparison of relevant features according to social media platforms
| Variable |
n (%) |
Test statistics | p-value | ||
|---|---|---|---|---|---|
| YouTube | TikTok | ||||
| Video length (sec) | 33.395 | <0.001* | |||
| 15–30 | 0 (0) | 3 (10.7) | 1 (1.6) | ||
| 30–45 | 2 (3.2) | 6 (21.4) | 18 (29.0) | ||
| >45 | 61 (96.8) | 16 (57.1) | 43 (69.4) | ||
| Source of upload | 18.502 | 0.006* | |||
| Healthcare professionals | 39 (61.9) | 23 (82.1) | 47 (75.8) | ||
| Hospital/university/dental clinics | 4 (6.3) | 0 (0) | 6 (9.7) | ||
| Commercial | 11 (17.5) | 1 (3.6) | 9 (14.5) | ||
| Layperson | 1 (1.6) | 0 (0) | 0 (0) | ||
| Others | 8 (12.7) | 4 (14.3) | 0 (0) | ||
| Video type | 9.743 | 0.066 | |||
| Educational | 53 (84.1) | 25 (89.3) | 60 (96.8) | ||
| Patient testimonial | 4 (6.3) | 0 (0) | 2 (3.2) | ||
| Product advertisement | 4 (6.3) | 1 (3.6) | 0 (0) | ||
| Entertainment | 2 (3.2) | 2 (7.1) | 0 (0) | ||
| VIQI | 46.196 | <0.001* | |||
| Score 1 | 9 (14.3) | 4 (14.3) | 8 (12.9) | ||
| Score 2 | 24 (38.1) | 16 (57.1) | 53 (85.5) | ||
| Score 3 | 19 (30.2) | 8 (28.6) | 1 (1.6) | ||
| Score 4 | 11 (17.5) | 0 (0) | 0 (0) | ||
| JAMA | 61.096 | 0.001* | |||
| Score 1 | 27 (42.9) | 9 (32.1) | 4 (6.5) | ||
| Score 2 | 19 (30.2) | 19 (67.9) | 58 (93.5) | ||
| Score 3 | 10 (15.9) | 0 (0) | 0 (0) | ||
| Score 4 | 7 (11.1) | 0 (0) | 0 (0) | ||
| GQS | 35.519 | <0.001* | |||
| Score 1 | 16 (25.4) | 1 (3.6) | 0 (0) | ||
| Score 2 | 23 (36.5) | 17 (60.7) | 32 (51.6) | ||
| Score 3 | 10 (15.9) | 4 (14.3) | 23 (37.1) | ||
| Score 4 | 10 (15.9) | 6 (21.4) | 7 (11.3) | ||
| Score 5 | 4 (6.3) | 0 (0) | 0 (0) | ||
| Tooth type | 9.725a) | 0.045* | |||
| Primary | 6 (9.5) | 2 (7.1) | 5 (8.1) | ||
| Immature permanent | 21 (33.3) | 2 (7.1) | 11 (17.7) | ||
| Mature permanent | 36 (57.1) | 24 (85.7) | 46 (74.2) | ||
| Pulp status | 29.041 | <0.001* | |||
| Vital | 39 (61.9) | 3 (10.7) | 41 (66.1) | ||
| Non-vital | 23 (36.5) | 22 (78.6) | 19 (30.6) | ||
| Vital and non-vital | 1 (1.6) | 3 (10.7) | 2 (3.2) | ||
| DISCERN 16 | 31.093 | <0.001* | |||
| Low | 20 (31.7) | 6 (21.4) | 1 (1.6) | ||
| Score 2 | 19 (30.2) | 13 (46.4) | 31 (50.0) | ||
| Moderate | 11 (17.5) | 6 (21.4) | 23 (37.1) | ||
| Score 4 | 10 (15.9) | 3 (10.7) | 7 (11.3) | ||
| High | 3 (4.8) | 0 (0) | 0 (0) | ||
| Usefulness | 34.119 | <0.001* | |||
| Low | 25 (39.7) | 24 (85.7) | 49 (79.0) | ||
| Medium | 25 (39.7) | 4 (14.3) | 13 (21.0) | ||
| High | 13 (20.6) | 0 (0) | 0 (0) | ||
Table 2.
Distribution and comparison of relevant features according to social media platforms
| Variable | YouTube | TikTok | Test statistics | p-value | |
|---|---|---|---|---|---|
| Number of views | 479,180.94 ± 1,534,013.86 (24,378) | 1,733,354.64 ± 8,178,266.69 (28,400) | 4,444.18 ± 6,117.09 (1,599) | 25.389 | <0.001* |
| Time since upload (mo) | 52.11 ± 42.06 (40) | 11.75 ± 11.26 (7) | 12.03 ± 8.85 (10) | 74.382 | <0.001* |
| Number of comments | 367.38 ± 1,710.56 (9) | 223.07 ± 779.02 (8.5) | 7.45 ± 13.68 (2) | 14.901 | 0.001* |
| Number of likes | 1,953.32 ± 5,837.96 (281.5) | 31,320.71 ± 109,900.76 (323) | 162.75 ± 265.22 (59) | 9.684 | 0.008* |
| Viewing rate | 1,843,026.82 ± 6,777,739.1 (63,990) | 19,110,127.04 ± 90,844,556.8 (248,166.67) | 113,127.31 ± 220,988.68 (15,608.49) | 17.149 | <0.001* |
| Usefulness | 6.97 ± 3.55 (6) | 3.71 ± 1.76 (4) | 4.45 ± 1.8 (4) | 29.710 | <0.001* |
| DISCERN section 1 | 20.65 ± 7.82 (20) | 18.71 ± 6.41 (18) | 17.35 ± 6.37 (16) | 4.073 | 0.131 |
| DISCERN section 2 | 17.25 ± 6.53 (15) | 12.78 ± 4.35 (12) | 10.97 ± 3.34 (10) | 43.107 | <0.001* |
| Total DISCERN | 38.06 ± 13.22 (35) | 31.7 ± 10.23 (29) | 29.61 ± 7.18 (28.5) | 18.178 | <0.001* |
Table 3.
Distribution and comparison of video characteristics according to VIQI scores
| VIQI score | YouTube | Test statistics/p-value | TikTok | Test statistics/p-value | Test statistics/p-value | |
|---|---|---|---|---|---|---|
| Number of views | 4.705/0.195 | 2.078/0.354 | 3.747/0.154 | |||
| Score 1 | 22,982.22 ± 36,853.51 (6,399) | 21,537.5 ± 25,013.85 (15,051.5) | 21.000 ± 0 (21.000) | |||
| Score 2 | 802,462.1 ± 2,176,896 (23,198) | 286,126.5 ± 555,202.3 (24.850) | 3,844.13 ± 5,513.04 (1,540) | |||
| Score 3 | 508,819.7 ± 1,305,315 (24,311) | 5,483,720 ± 15,322,667 (53.150) | 7.090 ± 0 (7.090) | |||
| Score 4 | 95,899.45 ± 144,939.6 (37,650) | - | - | |||
| Time since upload (mo) | 1.028/0.795 | 3.838/0.147 | 5.801/0.055 | |||
| Score 1 | 38.67 ± 25.26 (37) | 17.25 ± 16.17 (10.5) | 16.25 ± 9.5 (14.5) | |||
| Score 2 | 61.92 ± 54.87 (38) | 13.31 ± 11.67 (10.5) | 10.72 ± 7.09 (9) | |||
| Score 3 | 49.47 ± 39.15 (42) | 5.88 ± 4.76 (4.5) | 48 ± 0 (48) | |||
| Score 4 | 46.27 ± 18.2 (39) | - | - | |||
| Number of comments | 3.670/0.299 | 1.256/0.534 | 3.399/0.183 | |||
| Score 1 | 18.44 ± 30.72 (1) | 6 ± 3.92 (5.5) | 10 ± 16.74 (3) | |||
| Score 2 | 665.21 ± 2,707.22 (6.5) | 123.5 ± 275.32 (7.5) | 6.08 ± 11.22 (2) | |||
| Score 3 | 346.11 ± 682.95 (6) | 530.75 ± 1.421.47 (22) | 60 ± 0 (60) | |||
| Score 4 | 39.82 ± 53.22 (27) | - | - | |||
| Number of likes | 6.598/0.086 | 1.222/0.543 | 2.697/0.260 | |||
| Score 1 | 295.89 ± 485.03 (57) | 284.5 ± 288.01 (275.5) | 190.38 ± 289.45 (57.5) | |||
| Score 2 | 1,900.09 ± 3,963.94 (87) | 19,560.56 ± 51,370.47 (168) | 143.27 ± 244.87 (57.5) | |||
| Score 3 | 3,433 ± 9,569.03 (294) | 70,359.13 ± 195,765.5 (603) | 877 ± 0 (877) | |||
| Score 4 | 864.91 ± 617.09 (785) | - | - | |||
| Viewing rate | 3.827/0.281 | 4.738/0.094 | 1.374/0.503 | |||
| Score 1 | 66,352.09 ± 99,911.14 (15,734.88) | 130,034.8 ± 174,827 (55,091.11) | 210,000 ± 0 (210,000) | |||
| Score 2 | 3,237,364 ± 9,485,577 (67,051.76) | 1,888,423 ± 3,131,300 (221,061.4) | 113,173.7 ± 226,653.7 (14,089.74) | |||
| Score 3 | 1,868,451 ± 6,114,836 (63.940) | 63,043,581 ± 169,000,000 (907,500) | 14,770.83 ± 0 (14,770.83) | |||
| Score 4 | 210,565.9 ± 342,149.3 (96,538.46) | - | - | |||
| Usefulness | 31.307/<0.001* | 13.714/0.001* | 11.283/0.004* | |||
| Score 1 | 3.44 ± 1.67 (4) | 1.75 ± 0.5 (2) | 3 ± 0.53 (3) | |||
| Score 2 | 6.00 ± 2.09 (6) | 3.38 ± 1.2 (4) | 4.58 ± 1.74 (4) | |||
| Score 3 | 6.79 ± 3.1 (7) | 5.37 ± 1.77 (5) | 9 ± 0 (9) | |||
| Score 4 | 12.27 ± 2 (13) | - | - | |||
| DISCERN section 1 | 21.271/<0.001* | 16.445/<0.001* | 11.609/0.003* | |||
| Score 1 | 15.44 ± 4.64 (16) | 11.75 ± 2.63 (12.5) | 13.38 ± 1.6 (13.5) | |||
| Score 2 | 17.42 ± 4.02 (17.5) | 16.56 ± 4.02 (17) | 17.77 ± 6.54 (18) | |||
| Score 3 | 20.68 ± 6.05 (22) | 26.5 ± 3.66 (27.5) | 27 ± 0 (27) | |||
| Score 4 | 31.91 ± 8.37 (33) | - | - | |||
| DISCERN section 2 | 26.198/<0.001* | 10.685/0.005* | 2.600/0.273 | |||
| Score 1 | 11.00 ± 2.55 (10) | 8.5 ± 2.38 (7.5) | 9.75 ± 1.39 (10) | |||
| Score 2 | 15.21 ± 3.99 (15) | 11.87 ± 2.85 (12) | 11.02 ± 3.41 (10) | |||
| Score 3 | 18.00 ± 5.29 (19) | 16.63 ± 4.75 (16) | 18 ± 0 (18) | |||
| Score 4 | 25.55 ± 7.1 (27) | - | - | |||
| Total DISCERN | 27.794/<0.001* | 15.937/<0.001* | 13.672/0.001* | |||
| Score 1 | 26.44 ± 6.44 (27) | 20.25 ± 4.57 (20) | 23.13 ± 2.53 (24) | |||
| Score 2 | 33.04 ± 5.82 (33) | 28.67 ± 6.17 (28) | 30.3 ± 6.93 (29) | |||
| Score 3 | 38.68 ± 10.44 (40) | 43.13 ± 7.75 (44) | 45 ± 0 (45) | |||
| Score 4 | 57.45 ± 13.44 (56) | - | - | |||
Table 4.
Distribution and comparison of video characteristics according to JAMA scores
| JAMA score | YouTube | Test statistics/p-value | TikTok | Test statistics/p-value | Test statistics/p-value | |
|---|---|---|---|---|---|---|
| Number of views | 5.271/0.153 | 83.00/0.923 | - | |||
| Score 1 | 378,109.4 ± 1,238,790 (6,766) | 183,190.3 ± 457,782.9 (37,200) | - | |||
| Score 2 | 990,449.4 ± 2,329,163 (119,172) | 2,467,643 ± 9,922,817 (14,400) | 4,444.18 ± 6,117.09 (1,599) | |||
| Score 3 | 88,319.1 ± 157,050.4 (21,537.5) | - | - | |||
| Score 4 | 39,673.71 ± 27,415.88 (37,650) | - | - | |||
| Time since upload (mo) | 0.599/0.897 | 67.50/0.383 | 38.00/0.022* | |||
| Score 1 | 52.78 ± 47.34 (37) | 14.44 ± 13.02 (7) | 22.25 ± 8.85 (24) | |||
| Score 2 | 58.47 ± 48.35 (44) | 10.47 ± 10.46 (6) | 11.33 ± 8.47 (9.5) | |||
| Score 3 | 45.3 ± 28.19 (40.5) | - | - | |||
| Score 4 | 42 ± 6.14 (39) | - | - | |||
| Number of comments | 1.490/0.685 | 69.50/0.438 | 87.50/0.752 | |||
| Score 1 | 149.11 ± 486.82 (4) | 79.22 ± 220.82 (7) | 3.75 ± 7.5 (0) | |||
| Score 2 | 975.63 ± 3,027.77 (3) | 291.21 ± 934.56 (19) | 7.71 ± 14.01 (2) | |||
| Score 3 | 40.3 ± 61.6 (16.5) | - | - | |||
| Score 4 | 25.57 ± 11.76 (27) | - | - | |||
| Number of likes | 5.521/0.137 | 81.50/0.847 | 95.50/0.752 | |||
| Score 1 | 2,329.85 ± 8,364.47 (76) | 16,379.44 ± 48,091.81 (476) | 155.5 ± 206.23 (68) | |||
| Score 2 | 2,619.17 ± 3,545.8 (839.5) | 38,398.16 ± 130,095.5 (147) | 163.3 ± 270.73 (56) | |||
| Score 3 | 609.5 ± 656.54 (384) | - | - | |||
| Score 4 | 708.57 ± 513.75 (530) | - | - | |||
| Viewing rate | 6.060/0.109 | 84.00/0.962 | - | |||
| Score 1 | 1,468,307 ± 5,495,980 (27,175.76) | 951,094.8 ± 1,553,976 (250,000) | - | |||
| Score 2 | 3,886,522 ± 10,354,536 (243,780) | 27,711,774 ± 110,000,000 (246,333.3) | 113,127.3 ± 220,988.7 (15,608.49) | |||
| Score 3 | 189,657.2 ± 366,511.6 (61,617.56) | - | - | |||
| Score 4 | 103,702.6 ± 80,932.86 (96,538.46) | - | - | |||
| Usefulness | 34.905/<0.001* | 17.00/<0.001* | 32.50/0.012* | |||
| Score 1 | 4.56 ± 1.91 (4) | 2.22 ± 0.83 (2) | 2.75 ± 0.5 (3) | |||
| Score 2 | 6.63 ± 2.52 (6) | 4.42 ± 1.64 (4) | 4.57 ± 1.8 (4) | |||
| Score 3 | 10 ± 2.75 (11) | - | - | |||
| Score 4 | 12.86 ± 1.21 (13) | - | - | |||
| DISCERN section 1 | 29.00/<0.001* | 33.00/0.009* | 29.50/0.00* | |||
| Score 1 | 16.48 ± 4.48 (17) | 14.11 ± 3.66 (13) | 12.5 ± 1.73 (12) | |||
| Score 2 | 18 ± 4 (18) | 20.89 ± 6.33 (20) | 17.69 ± 6.44 (17) | |||
| Score 3 | 27.3 ± 4.83 (28.5) | - | ||||
| Score 4 | 34.43 ± 8.14 (39) | - | ||||
| DISCERN section 2 | 26.683/<0.001* | 19.50/0.001* | 62.50/0.129 | |||
| Score 1 | 13.93 ± 4.48 (13) | 9.44 ± 2.01 (10) | 8.75 ± 1.26 (9) | |||
| Score 2 | 15.79 ± 4.21 (15) | 14.44 ± 4.27 (14) | 11.12 ± 3.39 (10.5) | |||
| Score 3 | 20.6 ± 4.22 (21.5) | - | - | |||
| Score 4 | 29.29 ± 5.47 (29) | - | - | |||
| Total DISCERN | 33.492/<0.001* | 21.00/0.001* | 10.00/<0.001* | |||
| Score 1 | 30.78 ± 7.39 (30) | 23.56 ± 5.32 (22) | 21.25 ± 2.06 (21) | |||
| Score 2 | 33.79 ± 6.95 (34) | 35.78 ± 9.7 (35.5) | 30.19 ± 7.05 (29) | |||
| Score 3 | 47.9 ± 6.64 (49.5) | - | - | |||
| Score 4 | 63.71 ± 11.57 (69) | - | - | |||
Table 5.
Distribution and comparison of video characteristics according to GQS scores
| GQS score | YouTube | Test statistics/p-value | TikTok | Test statistics/p-value | Test statistics/p-value | |
|---|---|---|---|---|---|---|
| Number of views | 3.838/0.430 | 2.802/0.423 | 0.033/0.983 | |||
| Score 1 | 151,005.4 ± 362,704.6 (6,582.5) | 1.347 ± 0 (1.347) | - | |||
| Score 2 | 517,674 ± 1,339,250 (8,968) | 269,287.2 ± 541,128.1 (27,000) | 4,621.56 ± 6,769.52 (1.540) | |||
| Score 3 | 343,102.8 ± 664,023.6 (25,401) | 67,486 ± 100,969.8 (27,318.5) | 4,703.79 ± 6,261.99 (1,833) | |||
| Score 4 | 1,225,580 ± 3,201,189 (5,6061.5) | 7,280,793 ± 17.697.285 (53,150) | 2,826 ± 2,929.19 (1,882) | |||
| Score 5 | 44,744.75 ± 15,339.49 (45,169.5) | - | - | |||
| Time since upload (mo) | 1.656/0.799 | 2.714/0.438 | 2.250/0.325 | |||
| Score 1 | 60.06 ± 49.6 (43.5) | 7 ± 0 (7) | - | |||
| Score 2 | 56 ± 48.22 (34) | 15 ± 12.94 (14) | 12.59 ± 7.58 (12) | |||
| Score 3 | 41.9 ± 40.09 (31) | 7 ± 6.78 (4.5) | 10.26 ± 7.9 (7) | |||
| Score 4 | 45.2 ± 20.19 (40.5) | 6.5 ± 5.47 (5.5) | 15.29 ± 15.62 (9) | |||
| Score 5 | 40.75 ± 5.68 (39) | - | - | |||
| Number of comments | 6.491/0.165 | 2.131/0.546 | 0.259/0.879 | |||
| Score 1 | 100.88 ± 169.14 (5.5) | 2 ± 0 (2) | - | |||
| Score 2 | 187.04 ± 570.49 (1) | 115.59 ± 268.09 (8) | 8 ± 13.92 (2) | |||
| Score 3 | 196.8 ± 388.38 (22) | 25.25 ± 45.24 (4) | 5.48 ± 10.35 (2) | |||
| Score 4 | 1,515.2 ± 4,172.04 (26.5) | 696.33 ± 1.642.19 (22) | 11.43 ± 21.77 (3) | |||
| Score 5 | 27.25 ± 6.8 (28.5) | - | - | |||
| Number of likes | 6.121/0.190 | 3.699/0.296 | 1.387/0.500 | |||
| Score 1 | 602.5 ± 955.02 (94.5) | 13 ± 0 (13) | - | |||
| Score 2 | 3,120.17 ± 9,025.55 (62) | 18,412.76 ± 49,962.55 (245) | 186.37 ± 312.68 (60) | |||
| Score 3 | 2,279.4 ± 4,288.45 (357) | 730.5 ± 1.141.07 (255) | 105.33 ± 146.24 (48) | |||
| Score 4 | 1,523.67 ± 2,195.97 (785) | 93,504.67 ± 226,013.3 (603) | 245.67 ± 331.3 (92) | |||
| Score 5 | 798.75 ± 411.9 (747) | - | - | |||
| Viewing rate | 4.917/0.296 | 3.722/0.293 | 0.078/0.962 | |||
| Score 1 | 267,709.9 ± 767,297.3 (39,862.44) | 19,242.86 ± 0 (19,242.86) | - | |||
| Score 2 | 1,814,908 ± 5,918,441 (27,175.76) | 1,368,748 ± 2,150,512 (246,333.3) | 85,577.97 ± 115,544.8 (21,925.09) | |||
| Score 3 | 2,044,057 ± 4,160,927 (94,955.11) | 3,017,986 ± 5,174.793 (668,070) | 171,161.7 ± 318,336.8 (11,545.24) | |||
| Score 4 | 4,918,599 ± 14,008,711 (157,787.1) | 83,287,275 ± 196,000,000 (907,500) | 20,204.25 ± 5,670.6 (19,473.08) | |||
| Score 5 | 114,469.7 ± 49,763.08 (115,819.2) | - | - | |||
| Usefulness | 43.379/<0.001* | 14.150/0.003* | 42.576/<0.001* | |||
| Score 1 | 3.44 ± 1.59 (4) | 1 ± 0 (1) | - | 30.387/<0.001* | ||
| Score 2 | 5.87 ± 1.84 (6) | 3 ± 1.12 (3) | 3.25 ± 0.8 (3) | |||
| Score 3 | 8.9 ± 1.85 (9) | 4.25 ± 1.26 (4) | 5 ± 0.95 (5) | |||
| Score 4 | 10.7 ± 2.75 (12) | 5.83 ± 1.72 (5.5) | 8.14 ± 1.21 (9) | |||
| Score 5 | 13.25 ± 1.5 (14) | - | - | |||
| DISCERN section 1 | 38.766/<0.001* | 18.346/<0.001* | ||||
| Score 1 | 13.63 ± 4.01 (14) | 8 ± 0 (8) | ||||
| Score 2 | 18.22 ± 3.26 (18) | 15.53 ± 4.02 (14) | 14.97 ± 2.02 (15) | |||
| Score 3 | 24.3 ± 3.65 (23.5) | 21 ± 2.45 (21.5) | 17.48 ± 7.88 (20) | |||
| Score 4 | 27.1 ± 7.67 (28.5) | 28 ± 1.26 (28.5) | 27.86 ± 2.04 (28) | |||
| Score 5 | 37.5 ± 4.36 (39.5) | - | - | |||
| DISCERN section 2 | 27.068/<0.001* | 15.318/<0.001* | 16.945/<0.001* | |||
| Score 1 | 13.25 ± 5.04 (11.5) | 7 ± 0 (7) | ||||
| Score 2 | 14.74 ± 3.43 (15) | 10.69 ± 2.24 (10.5) | 9.94 ± 1.54 (10) | |||
| Score 3 | 18.7 ± 3.68 (19) | 14.25 ± 3.3 (13) | 10.43 ± 3.34 (9) | |||
| Score 4 | 22.9 ± 5.97 (25) | 18.33 ± 4.18 (18) | 17.43 ± 2.15 (17) | |||
| Score 5 | 30 ± 7.57 (33) | - | - | |||
| Total DISCERN | 40.803/<0.001* | 18.406/<0.001* | 44.075/<0.001* | |||
| Score 1 | 26.87 ± 6.48 (27) | 15 ± 0 (15) | ||||
| Score 2 | 33.39 ± 5.91 (33) | 26.37 ± 5.39 (27.5) | 24.91 ± 2.72 (24) | |||
| Score 3 | 43 ± 6.43 (41) | 35.25 ± 5.38 (34.5) | 31.39 ± 3.92 (31) | |||
| Score 4 | 50 ± 10.59 (50) | 46.33 ± 5.16 (47) | 45.29 ± 3.55 (45) | |||
| Score 5 | 67.5 ± 11.9 (72.5) | - | - |
Table 6.
Distribution and comparison of video characteristics according to Usefulness scores
|
Mean ± standard deviation (median) |
||||||
|---|---|---|---|---|---|---|
| Usefulness score | YouTube | Test statistics/p-value | TikTok | Test statistics/p-value | Test statistics/p-value | |
| Number of views | 1.300/0.522 | 5.000/0.857 | - | |||
| Low | 259,634.72 ± 727,192.99 (6,766) | 2,017,359.29 ± 8,827,612.77 (32,100) | 4,758.28 ± 6,885.41 (1,508) | |||
| Medium | 922,471.2 ± 2,278,840.25 (24.378) | 29,326.75 ± 33,688.52 (20.000) | 3,571.67 ± 3,310.77 (2,138) | |||
| High | 48,903.92 ± 63,046.87 (30,932) | - | - | |||
| Time since upload (mo) | 1.048/0.592 | 5.500/0.857 | 0.000/>0.999 | |||
| Low | 56.56 ± 45.18 (41) | 12.38 ± 11.93 (7) | 12.08 ± 8.01 (11) | |||
| Medium | 50.36 ± 47.46 (40) | 8 ± 5.35 (5.5) | 11.85 ± 11.88 (9) | |||
| High | 46.92 ± 21.83 (39) | - | - | |||
| Number of comments | 0.756/0.685 | 5.000/0.857 | 0.500/>0.999 | |||
| Low | 124.68 ± 276.77 (6) | 256.67 ± 839.05 (8.5) | 6.08 ± 11.71 (1) | |||
| Medium | 789.72 ± 2,677.76 (3) | 21.5 ± 36.64 (5) | 12.62 ± 19.16 (4) | |||
| High | 21.92 ± 12.49 (21) | - | - | |||
| Number of likes | 2.956/0.228 | 4.000/0.643 | 0.000/>0.999 | |||
| Low | 1,178.92 ± 2,960.21 (113) | 36,322.54 ± 118,301.69 (360.5) | 157.02 ± 268.99 (57.5) | |||
| Medium | 3,474.04 ± 8,778.57 (357) | 1,309.75 ± 2,310.08 (236.5) | 186.73 ± 259.86 (87) | |||
| High | 635.08 ± 511.3 (530) | - | - | |||
| Viewing rate | 2.516/0.284 | 3.000/0.429 | 0.000/>0.999 | |||
| Low | 682,163.46 ± 2,265,045,13 (59,295.12) | 22,225,090.3 ± 98,066,682.23 (305,000) | 132,031.87 ± 249,945.54 (10,633.33) | |||
| Medium | 3,911,802.75 ± 10,296,877.01 (224,852.83) | 420,347.5 ± 576,027.34 (195,125) | 60,614.66 ± 99,050.87 (22,500) | |||
| High | 97,041.1 ± 80,519.3 (83,600) | - | - | |||
| DISCERN section 1 | 33.073/<0.001* | 0.000/0.071 | 0.000/>0.999 | |||
| Low | 15 ± 4.37 (15) | 17.33 ± 5.77 (17) | 15.37 ± 5.36 (15) | |||
| Medium | 20.96 ± 4.09 (21) | 27 ± 2.83 (28) | 24.85 ± 3.8 (25) | |||
| High | 30.92 ± 7.96 (31) | - | - | |||
| DISCERN section 2 | 28.949/<0.001* | 0.000/>0.999 | ||||
| Low | 13.64 ± 5.09 (12) | 11.96 ± 3.86 (12) | 2.500/0.286 | 9.69 ± 1.47 (9) | ||
| Medium | 16.36 ± 3.73 (15) | 17.5 ± 4.51 (16) | 15.77 ± 4.04 (17) | |||
| High | 25.92 ± 5.53 (24) | - | - | |||
| Total DISCERN | 38.563/<0.001* | 0.000/0.071 | 0.000/>0.999 | |||
| Low | 28.64 ± 7.68 (28) | 29.48 ± 9.09 (28) | 26.69 ± 3.47 (27) | |||
| Medium | 37.72 ± 5.92 (39) | 44.5 ± 6.76 (44) | 40.62 ± 6.92 (43) | |||
| High | 56.85 ± 12.17 (52) | - | - | |||
- 1. Special Committee to Revise the Glossary; American Association of Endodontists (AAE). Glossary of endodontic terms [Internet]. 10th ed. Chicago, IL: AAE; 2020 [cited 2025 Mar 16]. Available from: https://www.aae.org/specialty/clinical-resources/glossary-endodontic-terms/
- 2. Dean JA. Treatment of deep caries, vital pulp exposure, and pulpless teeth. In: Dean JA, Avery DR, McDonald RE, editors. McDonald and Avery’s dentistry for the child and adolescent. 10th ed. Maryland Heights, MO: Elsevier; 2015. p. 221-253.
- 3. Bengi VU, Saraç Atagün Ö, Ceylan Şen S, Özcan E, Paksoy T, Güler ÖŞ. How much information regarding gingival enlargement can we get from TikTok and YouTube? Spec Care Dentist 2024;44:1115-1125.ArticlePubMed
- 4. Goel A, Gupta L. Social media in the times of COVID-19. J Clin Rheumatol 2020;26:220-223.ArticlePubMedPMC
- 5. Uzel İ, Ghabchi B, Akalın A, Eden E. YouTube as an information source in paediatric dentistry education: reliability and quality analysis. PLoS One 2023;18:e0283300.ArticlePubMedPMC
- 6. Vance K, Howe W, Dellavalle RP. Social internet sites as a source of public health information. Dermatol Clin 2009;27:133-136.ArticlePubMed
- 7. Aksoy M, Topsakal KG. YouTubeTM for information on paediatric oral health instructions. Int J Dent Hyg 2022;20:496-503.ArticlePubMedPDF
- 8. ElKarmi R, Hassona Y, Taimeh D, Scully C. YouTube as a source for parents’ education on early childhood caries. Int J Paediatr Dent 2017;27:437-443.ArticlePubMedPDF
- 9. Paksoy T, Ceylan Şen S, Ustaoğlu G, Bulut DG. What do TikTok videos offer us about dental implants treatment? J Stomatol Oral Maxillofac Surg 2023;124(1S):101320.ArticlePubMed
- 10. Yang SC, Wu BW, Karlis V, Saghezchi S. Current status of Instagram utilization by oral and maxillofacial surgery residency programs: a comparison with related dental and surgical specialties. J Oral Maxillofac Surg 2020;78:2128.ArticlePubMedPMC
- 11. Smyth RS, Amlani M, Fulton A, Sharif MO. The availability and characteristics of patient-focused YouTube videos related to oral hygiene instruction. Br Dent J 2020;228:773-781.ArticlePubMedPDF
- 12. Kong W, Song S, Zhao YC, Zhu Q, Sha L. TikTok as a health information source: assessment of the quality of information in diabetes-related videos. J Med Internet Res 2021;23:e30409.ArticlePubMedPMC
- 13. Nguyen VH, Lyden ER, Yoachim SD. Using Instagram as a tool to enhance anatomy learning at two US dental schools. J Dent Educ 2021;85:1525-1535.ArticlePubMedPDF
- 14. Google. Google Trends [Internet]. Mountain View, CA: Google LLC; c2021 [cited 2025 Jun 16]. Available from: https://trends.google.com/trends/?geo=TR
- 15. Hassona Y, Taimeh D, Marahleh A, Scully C. YouTube as a source of information on mouth (oral) cancer. Oral Dis 2016;22:202-208.ArticlePubMed
- 16. Arslan S, Korkmaz YN, Buyuk SK. Can TikTok provide reliable information about orthodontics for patients? J Consum Health Internet 2022;26:146-156.Article
- 17. Naseer S, Hasan S, Bhuiyan J, Prasad A. Current public trends in the discussion of dry eyes: a cross-sectional analysis of popular content on TikTok. Cureus 2022;14:e22702.ArticlePubMedPMC
- 18. AAE Position Statement on Vital Pulp Therapy. J Endod 2021;47:1340-1344.ArticlePubMed
- 19. Kratunova E, Silva D. Pulp therapy for primary and immature permanent teeth: an overview. Gen Dent 2018;66:30-38.PubMed
- 20. European Society of Endodontology (ESE), Duncan HF, Galler KM, Tomson PL, Simon S, El-Karim I, et al. European Society of Endodontology position statement: management of deep caries and the exposed pulp. Int Endod J 2019;52:923-934.ArticlePubMedPDF
- 21. Charnock D, Shepperd S, Needham G, Gann R. DISCERN: an instrument for judging the quality of written consumer health information on treatment choices. J Epidemiol Community Health 1999;53:105-111.ArticlePubMedPMC
- 22. Topsakal KG, Duran GS, Görgülü S, Eser Misir S. Is YouTubeTM an adequate source of oral hygiene education for orthodontic patients? Int J Dent Hyg 2022;20:504-511.ArticlePubMedPDF
- 23. Hatipoğlu Ş, Gaş S. Is information for surgically assisted rapid palatal expansion available on YouTube reliable? J Oral Maxillofac Surg 2020;78:1017.
- 24. Silberg WM, Lundberg GD, Musacchio RA. Assessing, controlling, and assuring the quality of medical information on the Internet: Caveant lector et viewor--Let the reader and viewer beware. JAMA 1997;277:1244-1245.ArticlePubMed
- 25. Popoola BO, Ayebameru OE, Olanloye OM. Endodontic treatment in children: a five-year retrospective study of cases seen at the University College Hospital, Ibadan, Nigeria. Ann Ib Postgrad Med 2018;16:136-141.PubMedPMC
- 26. Daher A, Abreu MH, Costa LR. Recognizing preschool children with primary teeth needing dental treatment because of caries-related toothache. Community Dent Oral Epidemiol 2015;43:298-307.ArticlePubMed
- 27. Shah A, Peacock R, Eliyas S. Pulp therapy and root canal treatment techniques in immature permanent teeth: an update. Br Dent J 2022;232:524-530.ArticlePubMedPDF
- 28. Montag C, Hegelich S. Understanding detrimental aspects of social media use: will the real culprits please stand up? Front Sociol 2020;5:599270.ArticlePubMedPMC
- 29. Oakley M, Spallek H. Social media in dental education: a call for research and action. J Dent Educ 2012;76:279-287.ArticlePubMedPMCPDF
- 30. Ozturk T, Gumus H. YouTube as an information and education source for early orthodontic treatment. Am J Orthod Dentofacial Orthop 2022;162:e123-e132.ArticlePubMed
- 31. AlFaris E, Irfan F, Ponnamperuma G, Jamal A, Van der Vleuten C, Al Maflehi N, et al. The pattern of social media use and its association with academic performance among medical students. Med Teach 2018;40(sup1):S77-S82.ArticlePubMed
- 32. Duman C. YouTubeTM quality as a source for parent education about the oral hygiene of children. Int J Dent Hyg 2020;18:261-267.ArticlePubMedPDF
- 33. Eghtesadi M, Florea A. Facebook, Instagram, Reddit and TikTok: a proposal for health authorities to integrate popular social media platforms in contingency planning amid a global pandemic outbreak. Can J Public Health 2020;111:389-391.ArticlePubMedPMCPDF
- 34. Özbay Y, Çırakoğlu NY. YouTube as an information source for instrument separation in root canal treatment. Restor Dent Endod 2021;46:e8.ArticlePubMedPMC
- 35. Topbaş C, Paksoy T, İslamoğlu AG, Çağlar K, Kul AK. Is it safe to learn about vital pulp capping from YouTubeTM videos?: a content and quality analysis. Int J Med Inform 2024;185:105409.ArticlePubMed
- 36. Lee VH, Kyoon-Achan G, Levesque J, Ghotra S, Hu R, Schroth RJ. Promoting early childhood oral health and preventing early childhood caries on Instagram. Front Oral Health 2023;3:1062421.ArticlePubMedPMC
- 37. Bernard A, Langille M, Hughes S, Rose C, Leddin D, Veldhuyzen van Zanten S. A systematic review of patient inflammatory bowel disease information resources on the World Wide Web. Am J Gastroenterol 2007;102:2070-2077.ArticlePubMed
- 38. Delli K, Livas C, Vissink A, Spijkervet FK. Is YouTube useful as a source of information for Sjögren’s syndrome? Oral Dis 2016;22:196-201.ArticlePubMed
- 39. Singh AG, Singh S, Singh PP. YouTube for information on rheumatoid arthritis: a wakeup call? J Rheumatol 2012;39:899-903.ArticlePubMed
- 40. Nishizaki N, Hirano D, Oishi K, Shimizu T. YouTube videos in Japanese as a source of information on nocturnal enuresis: a content-quality and reliability analysis. Pediatr Int 2022;64:e15049.ArticlePubMedPDF
- 41. de Oliveira Júnior AJ, Oliveira JM, Bretz YP, Mialhe FL. Online social networks for prevention and promotion of oral health: a systematic review. Can J Dent Hyg 2023;57:83-97.PubMedPMC
- 42. Kılınç DD. Is the information about orthodontics on Youtube and TikTok reliable for the oral health of the public?: a cross sectional comparative study. J Stomatol Oral Maxillofac Surg 2022;123:e349-e354.ArticlePubMed
- 43. McLean S, Cook N, Rovira-Wilde A, Patel S, Kanagasingam S. Evaluating YouTube as a patient information source for the risks of root canal treatment. J Endod 2023;49:155-161.ArticlePubMed
- 44. Kodonas K, Fardi A. YouTube as a source of information about pulpotomy and pulp capping: a cross sectional reliability analysis. Restor Dent Endod 2021;46:e40.ArticlePubMedPMCPDF
- 45. Jung MJ, Seo MS. Assessment of reliability and information quality of YouTube videos about root canal treatment after 2016. BMC Oral Health 2022;22:494.ArticlePubMedPMCPDF
- 46. Saraç Atagün Ö, Ceylan Şen S, Paksoy T. Analysis of YouTube videos as a source of information about dentin hypersensitivity. Int J Dent Hyg 2024;22:432-443.ArticlePubMed
REFERENCES
Tables & Figures
REFERENCES
Citations
Citations to this article as recorded by 
- Evaluating the reliability and educational quality of YouTube™ and TikTok™ videos on custom subperiosteal implants: a cross-sectional methodological analysis
Göksel Tımarcıoğlu, Erdal Cem Kargu, Hülya Çerçi Akçay, Başak Tımarcıoğlu
BMC Oral Health.2026;[Epub] CrossRef - New Technologies and Materials in Oral Health and Dental Care of Pediatric Dentistry
Giuseppe Minervini
Children.2025; 12(10): 1310. CrossRef
 ePub Link
 Cite
CiteComparison of YouTube, TikTok, and Instagram as digital sources for obtaining information about pulp therapy in primary and permanent teeth
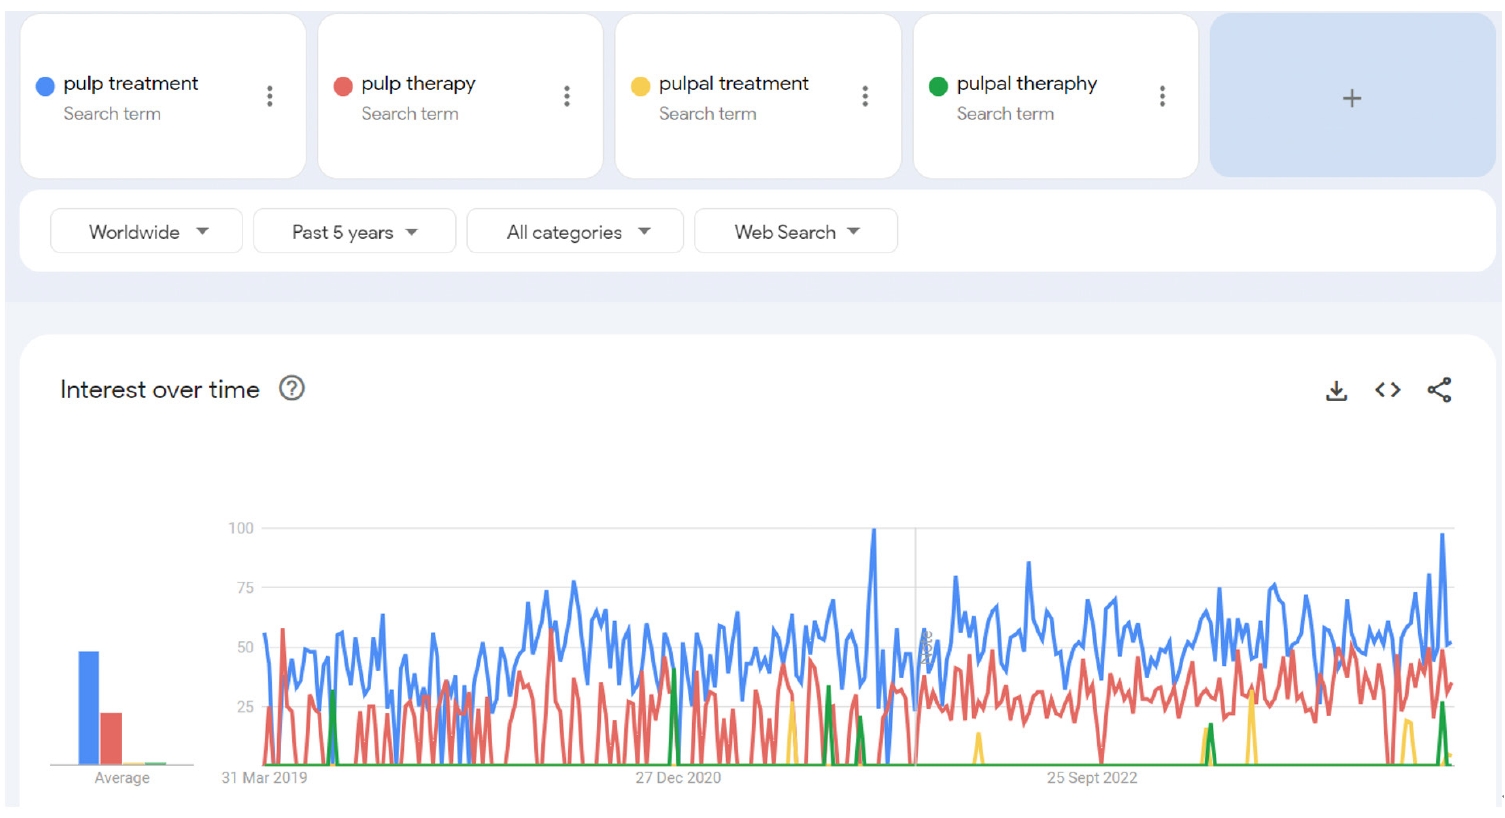
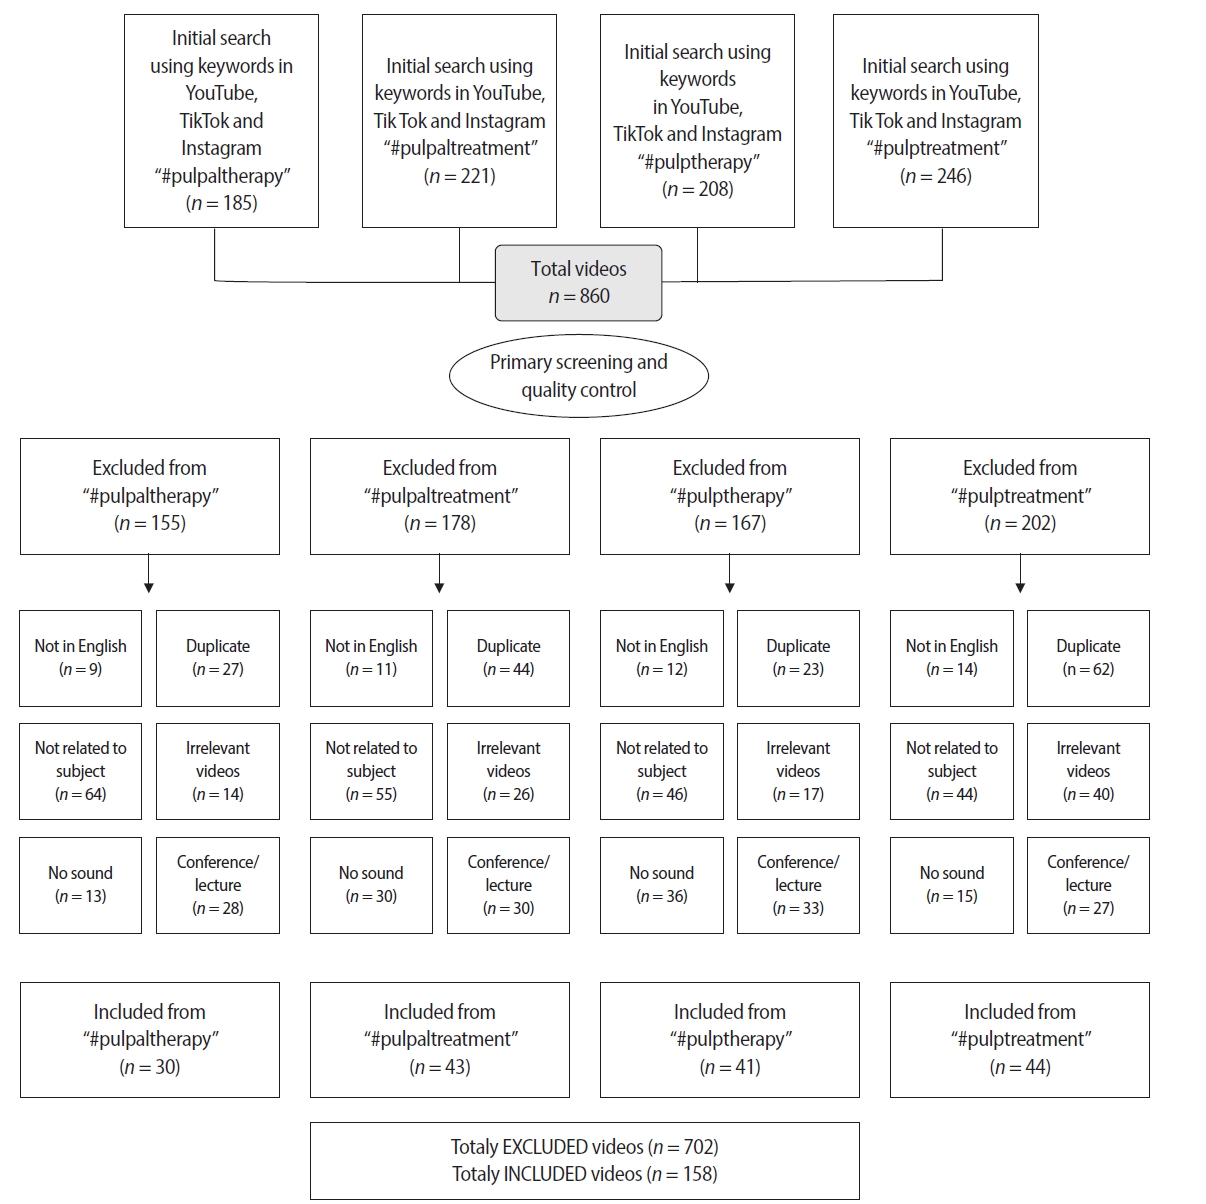

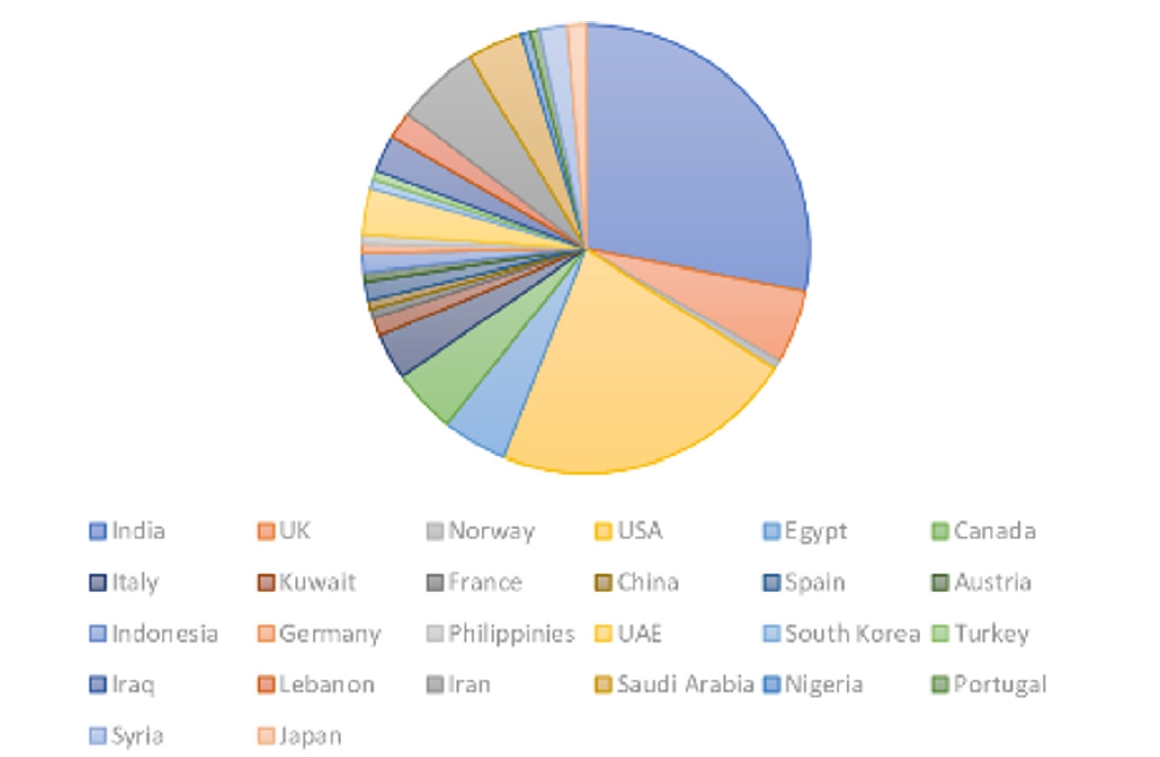
Figure 1. Appearance of hashtags in Google Trends [14].
Figure 2. Flow diagram of the data detected from the video platforms. YouTube: Google LLC, Mountain View, CA, USA. TikTok: ByteDance Ltd., Beijing, China. Instagram: Meta Platforms, Inc., Menlo Park, CA, USA.
Figure 3. Study design of the selection video situation.
Figure 4. Pie chart of country origin uploaded videos.
Figure 1.
Figure 2.
Figure 3.
Figure 4.
Comparison of YouTube, TikTok, and Instagram as digital sources for obtaining information about pulp therapy in primary and permanent teeth
| Variable | n (%) |
Test statistics | p-value | ||
|---|---|---|---|---|---|
| YouTube | TikTok | ||||
| Video length (sec) | 33.395 | <0.001 |
|||
| 15–30 | 0 (0) | 3 (10.7) | 1 (1.6) | ||
| 30–45 | 2 (3.2) | 6 (21.4) | 18 (29.0) | ||
| >45 | 61 (96.8) | 16 (57.1) | 43 (69.4) | ||
| Source of upload | 18.502 | 0.006 |
|||
| Healthcare professionals | 39 (61.9) | 23 (82.1) | 47 (75.8) | ||
| Hospital/university/dental clinics | 4 (6.3) | 0 (0) | 6 (9.7) | ||
| Commercial | 11 (17.5) | 1 (3.6) | 9 (14.5) | ||
| Layperson | 1 (1.6) | 0 (0) | 0 (0) | ||
| Others | 8 (12.7) | 4 (14.3) | 0 (0) | ||
| Video type | 9.743 | 0.066 | |||
| Educational | 53 (84.1) | 25 (89.3) | 60 (96.8) | ||
| Patient testimonial | 4 (6.3) | 0 (0) | 2 (3.2) | ||
| Product advertisement | 4 (6.3) | 1 (3.6) | 0 (0) | ||
| Entertainment | 2 (3.2) | 2 (7.1) | 0 (0) | ||
| VIQI | 46.196 | <0.001 |
|||
| Score 1 | 9 (14.3) | 4 (14.3) | 8 (12.9) | ||
| Score 2 | 24 (38.1) | 16 (57.1) | 53 (85.5) | ||
| Score 3 | 19 (30.2) | 8 (28.6) | 1 (1.6) | ||
| Score 4 | 11 (17.5) | 0 (0) | 0 (0) | ||
| JAMA | 61.096 | 0.001 |
|||
| Score 1 | 27 (42.9) | 9 (32.1) | 4 (6.5) | ||
| Score 2 | 19 (30.2) | 19 (67.9) | 58 (93.5) | ||
| Score 3 | 10 (15.9) | 0 (0) | 0 (0) | ||
| Score 4 | 7 (11.1) | 0 (0) | 0 (0) | ||
| GQS | 35.519 | <0.001 |
|||
| Score 1 | 16 (25.4) | 1 (3.6) | 0 (0) | ||
| Score 2 | 23 (36.5) | 17 (60.7) | 32 (51.6) | ||
| Score 3 | 10 (15.9) | 4 (14.3) | 23 (37.1) | ||
| Score 4 | 10 (15.9) | 6 (21.4) | 7 (11.3) | ||
| Score 5 | 4 (6.3) | 0 (0) | 0 (0) | ||
| Tooth type | 9.725 |
0.045 |
|||
| Primary | 6 (9.5) | 2 (7.1) | 5 (8.1) | ||
| Immature permanent | 21 (33.3) | 2 (7.1) | 11 (17.7) | ||
| Mature permanent | 36 (57.1) | 24 (85.7) | 46 (74.2) | ||
| Pulp status | 29.041 | <0.001 |
|||
| Vital | 39 (61.9) | 3 (10.7) | 41 (66.1) | ||
| Non-vital | 23 (36.5) | 22 (78.6) | 19 (30.6) | ||
| Vital and non-vital | 1 (1.6) | 3 (10.7) | 2 (3.2) | ||
| DISCERN 16 | 31.093 | <0.001 |
|||
| Low | 20 (31.7) | 6 (21.4) | 1 (1.6) | ||
| Score 2 | 19 (30.2) | 13 (46.4) | 31 (50.0) | ||
| Moderate | 11 (17.5) | 6 (21.4) | 23 (37.1) | ||
| Score 4 | 10 (15.9) | 3 (10.7) | 7 (11.3) | ||
| High | 3 (4.8) | 0 (0) | 0 (0) | ||
| Usefulness | 34.119 | <0.001 |
|||
| Low | 25 (39.7) | 24 (85.7) | 49 (79.0) | ||
| Medium | 25 (39.7) | 4 (14.3) | 13 (21.0) | ||
| High | 13 (20.6) | 0 (0) | 0 (0) | ||
| Variable | YouTube | TikTok | Test statistics | p-value | |
|---|---|---|---|---|---|
| Number of views | 479,180.94 ± 1,534,013.86 (24,378) | 1,733,354.64 ± 8,178,266.69 (28,400) | 4,444.18 ± 6,117.09 (1,599) | 25.389 | <0.001 |
| Time since upload (mo) | 52.11 ± 42.06 (40) | 11.75 ± 11.26 (7) | 12.03 ± 8.85 (10) | 74.382 | <0.001 |
| Number of comments | 367.38 ± 1,710.56 (9) | 223.07 ± 779.02 (8.5) | 7.45 ± 13.68 (2) | 14.901 | 0.001 |
| Number of likes | 1,953.32 ± 5,837.96 (281.5) | 31,320.71 ± 109,900.76 (323) | 162.75 ± 265.22 (59) | 9.684 | 0.008 |
| Viewing rate | 1,843,026.82 ± 6,777,739.1 (63,990) | 19,110,127.04 ± 90,844,556.8 (248,166.67) | 113,127.31 ± 220,988.68 (15,608.49) | 17.149 | <0.001 |
| Usefulness | 6.97 ± 3.55 (6) | 3.71 ± 1.76 (4) | 4.45 ± 1.8 (4) | 29.710 | <0.001 |
| DISCERN section 1 | 20.65 ± 7.82 (20) | 18.71 ± 6.41 (18) | 17.35 ± 6.37 (16) | 4.073 | 0.131 |
| DISCERN section 2 | 17.25 ± 6.53 (15) | 12.78 ± 4.35 (12) | 10.97 ± 3.34 (10) | 43.107 | <0.001 |
| Total DISCERN | 38.06 ± 13.22 (35) | 31.7 ± 10.23 (29) | 29.61 ± 7.18 (28.5) | 18.178 | <0.001 |
| VIQI score | YouTube | Test statistics/p-value | TikTok | Test statistics/p-value | Test statistics/p-value | |
|---|---|---|---|---|---|---|
| Number of views | 4.705/0.195 | 2.078/0.354 | 3.747/0.154 | |||
| Score 1 | 22,982.22 ± 36,853.51 (6,399) | 21,537.5 ± 25,013.85 (15,051.5) | 21.000 ± 0 (21.000) | |||
| Score 2 | 802,462.1 ± 2,176,896 (23,198) | 286,126.5 ± 555,202.3 (24.850) | 3,844.13 ± 5,513.04 (1,540) | |||
| Score 3 | 508,819.7 ± 1,305,315 (24,311) | 5,483,720 ± 15,322,667 (53.150) | 7.090 ± 0 (7.090) | |||
| Score 4 | 95,899.45 ± 144,939.6 (37,650) | - | - | |||
| Time since upload (mo) | 1.028/0.795 | 3.838/0.147 | 5.801/0.055 | |||
| Score 1 | 38.67 ± 25.26 (37) | 17.25 ± 16.17 (10.5) | 16.25 ± 9.5 (14.5) | |||
| Score 2 | 61.92 ± 54.87 (38) | 13.31 ± 11.67 (10.5) | 10.72 ± 7.09 (9) | |||
| Score 3 | 49.47 ± 39.15 (42) | 5.88 ± 4.76 (4.5) | 48 ± 0 (48) | |||
| Score 4 | 46.27 ± 18.2 (39) | - | - | |||
| Number of comments | 3.670/0.299 | 1.256/0.534 | 3.399/0.183 | |||
| Score 1 | 18.44 ± 30.72 (1) | 6 ± 3.92 (5.5) | 10 ± 16.74 (3) | |||
| Score 2 | 665.21 ± 2,707.22 (6.5) | 123.5 ± 275.32 (7.5) | 6.08 ± 11.22 (2) | |||
| Score 3 | 346.11 ± 682.95 (6) | 530.75 ± 1.421.47 (22) | 60 ± 0 (60) | |||
| Score 4 | 39.82 ± 53.22 (27) | - | - | |||
| Number of likes | 6.598/0.086 | 1.222/0.543 | 2.697/0.260 | |||
| Score 1 | 295.89 ± 485.03 (57) | 284.5 ± 288.01 (275.5) | 190.38 ± 289.45 (57.5) | |||
| Score 2 | 1,900.09 ± 3,963.94 (87) | 19,560.56 ± 51,370.47 (168) | 143.27 ± 244.87 (57.5) | |||
| Score 3 | 3,433 ± 9,569.03 (294) | 70,359.13 ± 195,765.5 (603) | 877 ± 0 (877) | |||
| Score 4 | 864.91 ± 617.09 (785) | - | - | |||
| Viewing rate | 3.827/0.281 | 4.738/0.094 | 1.374/0.503 | |||
| Score 1 | 66,352.09 ± 99,911.14 (15,734.88) | 130,034.8 ± 174,827 (55,091.11) | 210,000 ± 0 (210,000) | |||
| Score 2 | 3,237,364 ± 9,485,577 (67,051.76) | 1,888,423 ± 3,131,300 (221,061.4) | 113,173.7 ± 226,653.7 (14,089.74) | |||
| Score 3 | 1,868,451 ± 6,114,836 (63.940) | 63,043,581 ± 169,000,000 (907,500) | 14,770.83 ± 0 (14,770.83) | |||
| Score 4 | 210,565.9 ± 342,149.3 (96,538.46) | - | - | |||
| Usefulness | 31.307/<0.001 |
13.714/0.001 |
11.283/0.004 |
|||
| Score 1 | 3.44 ± 1.67 (4) | 1.75 ± 0.5 (2) | 3 ± 0.53 (3) | |||
| Score 2 | 6.00 ± 2.09 (6) | 3.38 ± 1.2 (4) | 4.58 ± 1.74 (4) | |||
| Score 3 | 6.79 ± 3.1 (7) | 5.37 ± 1.77 (5) | 9 ± 0 (9) | |||
| Score 4 | 12.27 ± 2 (13) | - | - | |||
| DISCERN section 1 | 21.271/<0.001 |
16.445/<0.001 |
11.609/0.003 |
|||
| Score 1 | 15.44 ± 4.64 (16) | 11.75 ± 2.63 (12.5) | 13.38 ± 1.6 (13.5) | |||
| Score 2 | 17.42 ± 4.02 (17.5) | 16.56 ± 4.02 (17) | 17.77 ± 6.54 (18) | |||
| Score 3 | 20.68 ± 6.05 (22) | 26.5 ± 3.66 (27.5) | 27 ± 0 (27) | |||
| Score 4 | 31.91 ± 8.37 (33) | - | - | |||
| DISCERN section 2 | 26.198/<0.001 |
10.685/0.005 |
2.600/0.273 | |||
| Score 1 | 11.00 ± 2.55 (10) | 8.5 ± 2.38 (7.5) | 9.75 ± 1.39 (10) | |||
| Score 2 | 15.21 ± 3.99 (15) | 11.87 ± 2.85 (12) | 11.02 ± 3.41 (10) | |||
| Score 3 | 18.00 ± 5.29 (19) | 16.63 ± 4.75 (16) | 18 ± 0 (18) | |||
| Score 4 | 25.55 ± 7.1 (27) | - | - | |||
| Total DISCERN | 27.794/<0.001 |
15.937/<0.001 |
13.672/0.001 |
|||
| Score 1 | 26.44 ± 6.44 (27) | 20.25 ± 4.57 (20) | 23.13 ± 2.53 (24) | |||
| Score 2 | 33.04 ± 5.82 (33) | 28.67 ± 6.17 (28) | 30.3 ± 6.93 (29) | |||
| Score 3 | 38.68 ± 10.44 (40) | 43.13 ± 7.75 (44) | 45 ± 0 (45) | |||
| Score 4 | 57.45 ± 13.44 (56) | - | - | |||
| JAMA score | YouTube | Test statistics/p-value | TikTok | Test statistics/p-value | Test statistics/p-value | |
|---|---|---|---|---|---|---|
| Number of views | 5.271/0.153 | 83.00/0.923 | - | |||
| Score 1 | 378,109.4 ± 1,238,790 (6,766) | 183,190.3 ± 457,782.9 (37,200) | - | |||
| Score 2 | 990,449.4 ± 2,329,163 (119,172) | 2,467,643 ± 9,922,817 (14,400) | 4,444.18 ± 6,117.09 (1,599) | |||
| Score 3 | 88,319.1 ± 157,050.4 (21,537.5) | - | - | |||
| Score 4 | 39,673.71 ± 27,415.88 (37,650) | - | - | |||
| Time since upload (mo) | 0.599/0.897 | 67.50/0.383 | 38.00/0.022 |
|||
| Score 1 | 52.78 ± 47.34 (37) | 14.44 ± 13.02 (7) | 22.25 ± 8.85 (24) | |||
| Score 2 | 58.47 ± 48.35 (44) | 10.47 ± 10.46 (6) | 11.33 ± 8.47 (9.5) | |||
| Score 3 | 45.3 ± 28.19 (40.5) | - | - | |||
| Score 4 | 42 ± 6.14 (39) | - | - | |||
| Number of comments | 1.490/0.685 | 69.50/0.438 | 87.50/0.752 | |||
| Score 1 | 149.11 ± 486.82 (4) | 79.22 ± 220.82 (7) | 3.75 ± 7.5 (0) | |||
| Score 2 | 975.63 ± 3,027.77 (3) | 291.21 ± 934.56 (19) | 7.71 ± 14.01 (2) | |||
| Score 3 | 40.3 ± 61.6 (16.5) | - | - | |||
| Score 4 | 25.57 ± 11.76 (27) | - | - | |||
| Number of likes | 5.521/0.137 | 81.50/0.847 | 95.50/0.752 | |||
| Score 1 | 2,329.85 ± 8,364.47 (76) | 16,379.44 ± 48,091.81 (476) | 155.5 ± 206.23 (68) | |||
| Score 2 | 2,619.17 ± 3,545.8 (839.5) | 38,398.16 ± 130,095.5 (147) | 163.3 ± 270.73 (56) | |||
| Score 3 | 609.5 ± 656.54 (384) | - | - | |||
| Score 4 | 708.57 ± 513.75 (530) | - | - | |||
| Viewing rate | 6.060/0.109 | 84.00/0.962 | - | |||
| Score 1 | 1,468,307 ± 5,495,980 (27,175.76) | 951,094.8 ± 1,553,976 (250,000) | - | |||
| Score 2 | 3,886,522 ± 10,354,536 (243,780) | 27,711,774 ± 110,000,000 (246,333.3) | 113,127.3 ± 220,988.7 (15,608.49) | |||
| Score 3 | 189,657.2 ± 366,511.6 (61,617.56) | - | - | |||
| Score 4 | 103,702.6 ± 80,932.86 (96,538.46) | - | - | |||
| Usefulness | 34.905/<0.001 |
17.00/<0.001 |
32.50/0.012 |
|||
| Score 1 | 4.56 ± 1.91 (4) | 2.22 ± 0.83 (2) | 2.75 ± 0.5 (3) | |||
| Score 2 | 6.63 ± 2.52 (6) | 4.42 ± 1.64 (4) | 4.57 ± 1.8 (4) | |||
| Score 3 | 10 ± 2.75 (11) | - | - | |||
| Score 4 | 12.86 ± 1.21 (13) | - | - | |||
| DISCERN section 1 | 29.00/<0.001 |
33.00/0.009 |
29.50/0.00 |
|||
| Score 1 | 16.48 ± 4.48 (17) | 14.11 ± 3.66 (13) | 12.5 ± 1.73 (12) | |||
| Score 2 | 18 ± 4 (18) | 20.89 ± 6.33 (20) | 17.69 ± 6.44 (17) | |||
| Score 3 | 27.3 ± 4.83 (28.5) | - | ||||
| Score 4 | 34.43 ± 8.14 (39) | - | ||||
| DISCERN section 2 | 26.683/<0.001 |
19.50/0.001 |
62.50/0.129 | |||
| Score 1 | 13.93 ± 4.48 (13) | 9.44 ± 2.01 (10) | 8.75 ± 1.26 (9) | |||
| Score 2 | 15.79 ± 4.21 (15) | 14.44 ± 4.27 (14) | 11.12 ± 3.39 (10.5) | |||
| Score 3 | 20.6 ± 4.22 (21.5) | - | - | |||
| Score 4 | 29.29 ± 5.47 (29) | - | - | |||
| Total DISCERN | 33.492/<0.001 |
21.00/0.001 |
10.00/<0.001 |
|||
| Score 1 | 30.78 ± 7.39 (30) | 23.56 ± 5.32 (22) | 21.25 ± 2.06 (21) | |||
| Score 2 | 33.79 ± 6.95 (34) | 35.78 ± 9.7 (35.5) | 30.19 ± 7.05 (29) | |||
| Score 3 | 47.9 ± 6.64 (49.5) | - | - | |||
| Score 4 | 63.71 ± 11.57 (69) | - | - | |||
| GQS score | YouTube | Test statistics/p-value | TikTok | Test statistics/p-value | Test statistics/p-value | |
|---|---|---|---|---|---|---|
| Number of views | 3.838/0.430 | 2.802/0.423 | 0.033/0.983 | |||
| Score 1 | 151,005.4 ± 362,704.6 (6,582.5) | 1.347 ± 0 (1.347) | - | |||
| Score 2 | 517,674 ± 1,339,250 (8,968) | 269,287.2 ± 541,128.1 (27,000) | 4,621.56 ± 6,769.52 (1.540) | |||
| Score 3 | 343,102.8 ± 664,023.6 (25,401) | 67,486 ± 100,969.8 (27,318.5) | 4,703.79 ± 6,261.99 (1,833) | |||
| Score 4 | 1,225,580 ± 3,201,189 (5,6061.5) | 7,280,793 ± 17.697.285 (53,150) | 2,826 ± 2,929.19 (1,882) | |||
| Score 5 | 44,744.75 ± 15,339.49 (45,169.5) | - | - | |||
| Time since upload (mo) | 1.656/0.799 | 2.714/0.438 | 2.250/0.325 | |||
| Score 1 | 60.06 ± 49.6 (43.5) | 7 ± 0 (7) | - | |||
| Score 2 | 56 ± 48.22 (34) | 15 ± 12.94 (14) | 12.59 ± 7.58 (12) | |||
| Score 3 | 41.9 ± 40.09 (31) | 7 ± 6.78 (4.5) | 10.26 ± 7.9 (7) | |||
| Score 4 | 45.2 ± 20.19 (40.5) | 6.5 ± 5.47 (5.5) | 15.29 ± 15.62 (9) | |||
| Score 5 | 40.75 ± 5.68 (39) | - | - | |||
| Number of comments | 6.491/0.165 | 2.131/0.546 | 0.259/0.879 | |||
| Score 1 | 100.88 ± 169.14 (5.5) | 2 ± 0 (2) | - | |||
| Score 2 | 187.04 ± 570.49 (1) | 115.59 ± 268.09 (8) | 8 ± 13.92 (2) | |||
| Score 3 | 196.8 ± 388.38 (22) | 25.25 ± 45.24 (4) | 5.48 ± 10.35 (2) | |||
| Score 4 | 1,515.2 ± 4,172.04 (26.5) | 696.33 ± 1.642.19 (22) | 11.43 ± 21.77 (3) | |||
| Score 5 | 27.25 ± 6.8 (28.5) | - | - | |||
| Number of likes | 6.121/0.190 | 3.699/0.296 | 1.387/0.500 | |||
| Score 1 | 602.5 ± 955.02 (94.5) | 13 ± 0 (13) | - | |||
| Score 2 | 3,120.17 ± 9,025.55 (62) | 18,412.76 ± 49,962.55 (245) | 186.37 ± 312.68 (60) | |||
| Score 3 | 2,279.4 ± 4,288.45 (357) | 730.5 ± 1.141.07 (255) | 105.33 ± 146.24 (48) | |||
| Score 4 | 1,523.67 ± 2,195.97 (785) | 93,504.67 ± 226,013.3 (603) | 245.67 ± 331.3 (92) | |||
| Score 5 | 798.75 ± 411.9 (747) | - | - | |||
| Viewing rate | 4.917/0.296 | 3.722/0.293 | 0.078/0.962 | |||
| Score 1 | 267,709.9 ± 767,297.3 (39,862.44) | 19,242.86 ± 0 (19,242.86) | - | |||
| Score 2 | 1,814,908 ± 5,918,441 (27,175.76) | 1,368,748 ± 2,150,512 (246,333.3) | 85,577.97 ± 115,544.8 (21,925.09) | |||
| Score 3 | 2,044,057 ± 4,160,927 (94,955.11) | 3,017,986 ± 5,174.793 (668,070) | 171,161.7 ± 318,336.8 (11,545.24) | |||
| Score 4 | 4,918,599 ± 14,008,711 (157,787.1) | 83,287,275 ± 196,000,000 (907,500) | 20,204.25 ± 5,670.6 (19,473.08) | |||
| Score 5 | 114,469.7 ± 49,763.08 (115,819.2) | - | - | |||
| Usefulness | 43.379/<0.001 |
14.150/0.003 |
42.576/<0.001 |
|||
| Score 1 | 3.44 ± 1.59 (4) | 1 ± 0 (1) | - | 30.387/<0.001 |
||
| Score 2 | 5.87 ± 1.84 (6) | 3 ± 1.12 (3) | 3.25 ± 0.8 (3) | |||
| Score 3 | 8.9 ± 1.85 (9) | 4.25 ± 1.26 (4) | 5 ± 0.95 (5) | |||
| Score 4 | 10.7 ± 2.75 (12) | 5.83 ± 1.72 (5.5) | 8.14 ± 1.21 (9) | |||
| Score 5 | 13.25 ± 1.5 (14) | - | - | |||
| DISCERN section 1 | 38.766/<0.001 |
18.346/<0.001 |
||||
| Score 1 | 13.63 ± 4.01 (14) | 8 ± 0 (8) | ||||
| Score 2 | 18.22 ± 3.26 (18) | 15.53 ± 4.02 (14) | 14.97 ± 2.02 (15) | |||
| Score 3 | 24.3 ± 3.65 (23.5) | 21 ± 2.45 (21.5) | 17.48 ± 7.88 (20) | |||
| Score 4 | 27.1 ± 7.67 (28.5) | 28 ± 1.26 (28.5) | 27.86 ± 2.04 (28) | |||
| Score 5 | 37.5 ± 4.36 (39.5) | - | - | |||
| DISCERN section 2 | 27.068/<0.001 |
15.318/<0.001 |
16.945/<0.001 |
|||
| Score 1 | 13.25 ± 5.04 (11.5) | 7 ± 0 (7) | ||||
| Score 2 | 14.74 ± 3.43 (15) | 10.69 ± 2.24 (10.5) | 9.94 ± 1.54 (10) | |||
| Score 3 | 18.7 ± 3.68 (19) | 14.25 ± 3.3 (13) | 10.43 ± 3.34 (9) | |||
| Score 4 | 22.9 ± 5.97 (25) | 18.33 ± 4.18 (18) | 17.43 ± 2.15 (17) | |||
| Score 5 | 30 ± 7.57 (33) | - | - | |||
| Total DISCERN | 40.803/<0.001 |
18.406/<0.001 |
44.075/<0.001 |
|||
| Score 1 | 26.87 ± 6.48 (27) | 15 ± 0 (15) | ||||
| Score 2 | 33.39 ± 5.91 (33) | 26.37 ± 5.39 (27.5) | 24.91 ± 2.72 (24) | |||
| Score 3 | 43 ± 6.43 (41) | 35.25 ± 5.38 (34.5) | 31.39 ± 3.92 (31) | |||
| Score 4 | 50 ± 10.59 (50) | 46.33 ± 5.16 (47) | 45.29 ± 3.55 (45) | |||
| Score 5 | 67.5 ± 11.9 (72.5) | - | - |
| Mean ± standard deviation (median) |
||||||
|---|---|---|---|---|---|---|
| Usefulness score | YouTube | Test statistics/p-value | TikTok | Test statistics/p-value | Test statistics/p-value | |
| Number of views | 1.300/0.522 | 5.000/0.857 | - | |||
| Low | 259,634.72 ± 727,192.99 (6,766) | 2,017,359.29 ± 8,827,612.77 (32,100) | 4,758.28 ± 6,885.41 (1,508) | |||
| Medium | 922,471.2 ± 2,278,840.25 (24.378) | 29,326.75 ± 33,688.52 (20.000) | 3,571.67 ± 3,310.77 (2,138) | |||
| High | 48,903.92 ± 63,046.87 (30,932) | - | - | |||
| Time since upload (mo) | 1.048/0.592 | 5.500/0.857 | 0.000/>0.999 | |||
| Low | 56.56 ± 45.18 (41) | 12.38 ± 11.93 (7) | 12.08 ± 8.01 (11) | |||
| Medium | 50.36 ± 47.46 (40) | 8 ± 5.35 (5.5) | 11.85 ± 11.88 (9) | |||
| High | 46.92 ± 21.83 (39) | - | - | |||
| Number of comments | 0.756/0.685 | 5.000/0.857 | 0.500/>0.999 | |||
| Low | 124.68 ± 276.77 (6) | 256.67 ± 839.05 (8.5) | 6.08 ± 11.71 (1) | |||
| Medium | 789.72 ± 2,677.76 (3) | 21.5 ± 36.64 (5) | 12.62 ± 19.16 (4) | |||
| High | 21.92 ± 12.49 (21) | - | - | |||
| Number of likes | 2.956/0.228 | 4.000/0.643 | 0.000/>0.999 | |||
| Low | 1,178.92 ± 2,960.21 (113) | 36,322.54 ± 118,301.69 (360.5) | 157.02 ± 268.99 (57.5) | |||
| Medium | 3,474.04 ± 8,778.57 (357) | 1,309.75 ± 2,310.08 (236.5) | 186.73 ± 259.86 (87) | |||
| High | 635.08 ± 511.3 (530) | - | - | |||
| Viewing rate | 2.516/0.284 | 3.000/0.429 | 0.000/>0.999 | |||
| Low | 682,163.46 ± 2,265,045,13 (59,295.12) | 22,225,090.3 ± 98,066,682.23 (305,000) | 132,031.87 ± 249,945.54 (10,633.33) | |||
| Medium | 3,911,802.75 ± 10,296,877.01 (224,852.83) | 420,347.5 ± 576,027.34 (195,125) | 60,614.66 ± 99,050.87 (22,500) | |||
| High | 97,041.1 ± 80,519.3 (83,600) | - | - | |||
| DISCERN section 1 | 33.073/<0.001 |
0.000/0.071 | 0.000/>0.999 | |||
| Low | 15 ± 4.37 (15) | 17.33 ± 5.77 (17) | 15.37 ± 5.36 (15) | |||
| Medium | 20.96 ± 4.09 (21) | 27 ± 2.83 (28) | 24.85 ± 3.8 (25) | |||
| High | 30.92 ± 7.96 (31) | - | - | |||
| DISCERN section 2 | 28.949/<0.001 |
0.000/>0.999 | ||||
| Low | 13.64 ± 5.09 (12) | 11.96 ± 3.86 (12) | 2.500/0.286 | 9.69 ± 1.47 (9) | ||
| Medium | 16.36 ± 3.73 (15) | 17.5 ± 4.51 (16) | 15.77 ± 4.04 (17) | |||
| High | 25.92 ± 5.53 (24) | - | - | |||
| Total DISCERN | 38.563/<0.001 |
0.000/0.071 | 0.000/>0.999 | |||
| Low | 28.64 ± 7.68 (28) | 29.48 ± 9.09 (28) | 26.69 ± 3.47 (27) | |||
| Medium | 37.72 ± 5.92 (39) | 44.5 ± 6.76 (44) | 40.62 ± 6.92 (43) | |||
| High | 56.85 ± 12.17 (52) | - | - | |||
Table 1. Distribution and comparison of relevant features according to social media platforms
GQS, Global Quality Scale; JAMA, Journal of the American Medical Association; VIQI, Video Information and Quality Index. YouTube: Google LLC, Mountain View, CA, USA. TikTok: ByteDance Ltd., Beijing, China. Instagram: Meta Platforms, Inc., Menlo Park, CA, USA. Pearson chi-square test.
Table 2. Distribution and comparison of relevant features according to social media platforms
Values are presented as mean ± standard deviation (median). YouTube: Google LLC, Mountain View, CA, USA. TikTok: ByteDance Ltd., Beijing, China. Instagram: Meta Platforms, Inc., Menlo Park, CA, USA.
Table 3. Distribution and comparison of video characteristics according to VIQI scores
Values are presented as mean ± standard deviation (median). VIQI, Video Information and Quality Index. YouTube: Google LLC, Mountain View, CA, USA. TikTok: ByteDance Ltd., Beijing, China. Instagram: Meta Platforms, Inc., Menlo Park, CA, USA.
Table 4. Distribution and comparison of video characteristics according to JAMA scores
Values are presented as mean ± standard deviation (median). JAMA, Journal of the American Medical Association. YouTube: Google LLC, Mountain View, CA, USA. TikTok: ByteDance Ltd., Beijing, China. Instagram: Meta Platforms, Inc., Menlo Park, CA, USA.
Table 5. Distribution and comparison of video characteristics according to GQS scores
Values are presented as mean ± standard deviation (median). GQS, Global Quality Scale. YouTube: Google LLC, Mountain View, CA, USA. TikTok: ByteDance Ltd., Beijing, China. Instagram: Meta Platforms, Inc., Menlo Park, CA, USA.
Table 6. Distribution and comparison of video characteristics according to Usefulness scores
Values are presented as mean ± standard deviation (median). YouTube: Google LLC, Mountain View, CA, USA. TikTok: ByteDance Ltd., Beijing, China. Instagram: Meta Platforms, Inc., Menlo Park, CA, USA.

