
Articles
- Page Path
- HOME > Restor Dent Endod > Volume 32(2); 2007 > Article
- Original Article The effect of the pH of remineralized buffer solutions on dentin remineralization
- Sung-Chul Kim, Bung-Duk Roh, Il-Young Jung, Chan-Young Lee
-
2007;32(2):-161.
DOI: https://doi.org/10.5395/JKACD.2007.32.2.151
Published online: March 31, 2007
Department of Conservative Dentistry, College of Dentistry, Yonsei University, Korea.
- Corresponding Author: Chan-Young Lee. Department of Conservative Dentistry, College of Dentistry, Yonsei University, 134, Shinchon-dong, Seodaemun-gu, Seoul, 120-752, Korea. Tel: 82-2-2228-8700, chanyoungl@yumc.yonsei.ac.kr
• Received: January 25, 2007 • Revised: February 15, 2007 • Accepted: February 22, 2007
Copyright © 2007 Korean Academy of Conservative Dentistry
- 1,872 Views
- 3 Download
- 2 Crossref


Tables & Figures
REFERENCES
Citations
Citations to this article as recorded by 
- Remineralization Effects of Silver Fluoride, Silver Diamine Fluoride, and Sodium Fluoride Varnish
Jihyeon Lee, Hwalim Lee, Jongsoo Kim, Joonhaeng Lee, Jongbin Kim, Jisun Shin, Miran Han
International Journal of Clinical Preventive Dentistry.2024; 20(1): 19. CrossRef - The remineralizing features of pH 5.5 solutions of different degree of saturations on artificially demineralized enamel
Young-Jun Kwak, Eui-seoug Kim, Sung-Ho Park, Hyung Kyu Gong, Yoon Lee, Chan-Young Lee
Journal of Korean Academy of Conservative Dentistry.2008; 33(5): 481. CrossRef
 ePub Link
 Cite
CiteThe effect of the pH of remineralized buffer solutions on dentin remineralization


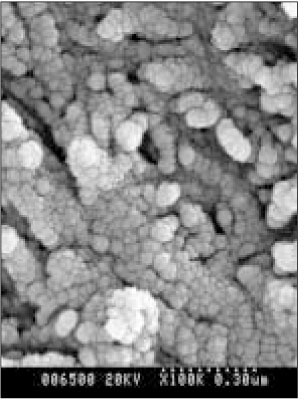


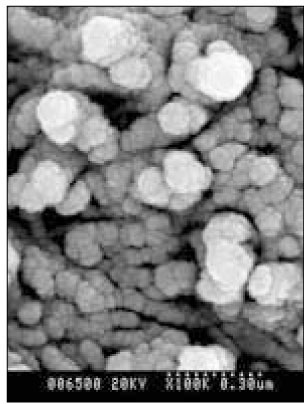


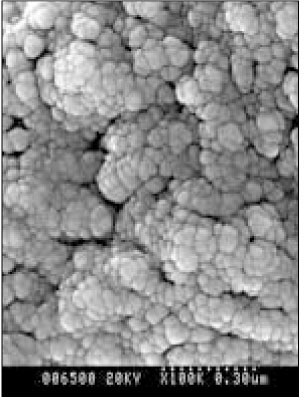


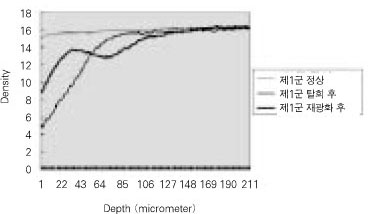
Figure 1
Quantitative mineral density change of dentin during de- & remineralization of pH 4.3 group.
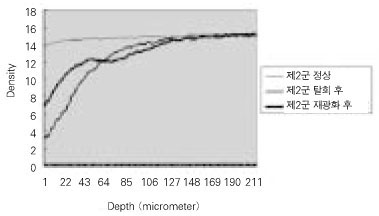
Figure 2
Quantitative mineral density change of dentin during de- & remineralization of pH 5.0 group.
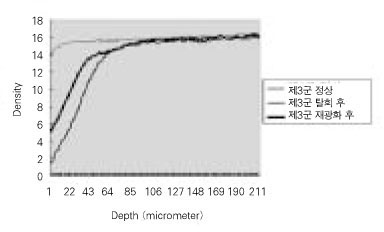
Figure 3
Quantitative mineral density change of dentin during de- & remineralization of pH 5.5 group.
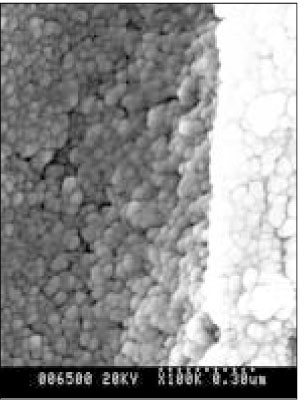
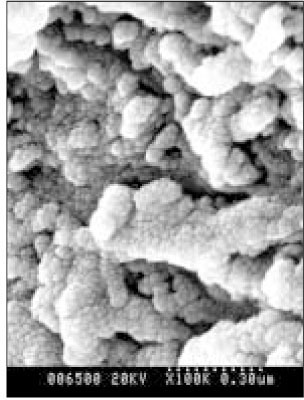
Figure 4
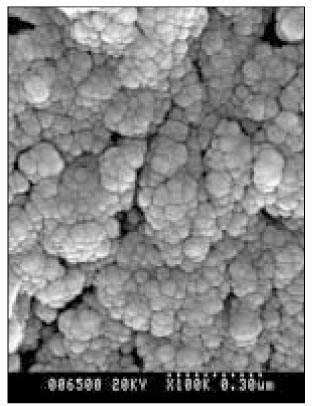
SEM micrograph of normal dentin (× 100,000).
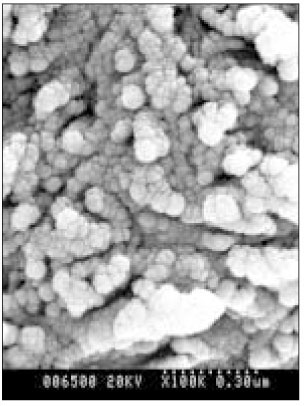
Figure 5
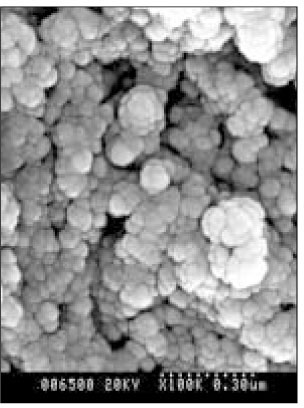
SEM micrograph of the demineralized dentin (× 100,000).
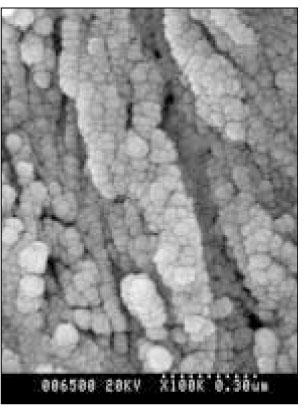
Figure 6
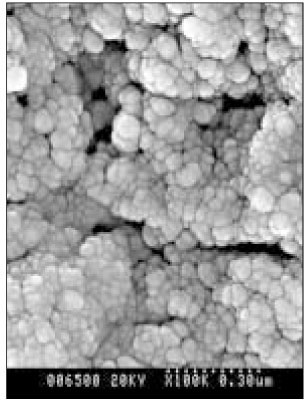
SEM micrograph of the remineralizeddentin of pH 4.3 group at 30 µm area from the surface layer (× 100,000).
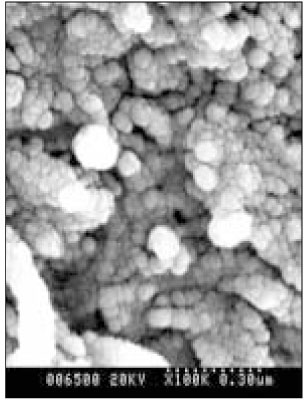
Figure 7
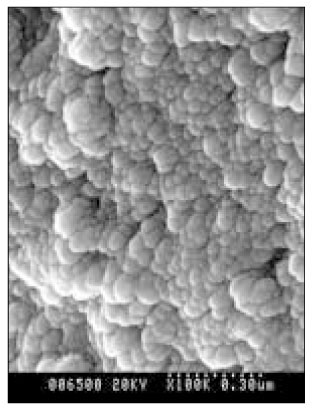
SEM micrograph of the demineralized dentin of pH 4.3 group at 70 µm area from the surface layer (× 100,000).
Figure 8
SEM micrograph of the remineralized dentin of pH 5.0 group at 50 µm area from the surface layer (× 100,000).
Figure 9
SEM micrograph of the demineralized dentin of pH 5.0 group at 70 µm area from thesurface layer (× 100,000).
Figure 10
SEM micrograph of the remineralized dentin of pH 5.5 group at 40 µm area from the surface layer (× 100,000).
Figure 11
SEM micrograph of the remineralized dentin of pH 5.5 group at 70 µm area from the surface layer (× 100,000).
Figure 12
SEM micrograph of the remineralized dentin of pH 4.3 group at 30 µm area from the surface layer (× 100,000).
Figure 13
SEM micrograph of the remineralized dentin of pH 4.3 group at 70 µm area from the surface layer (× 100,000).
Figure 14
SEM micrograph of the remineralized dentin of pH 5.0 group at 50 µm area from the surface layer (× 100,000).
Figure 15
SEM micrograph of the remineralized dentin of pH 5.0 group at 70 µm area from the surface layer (× 100,000).
Figure 16
SEM micrograph of the remineralized dentin of pH 5.5 group at 40 µm area from the surface layer (× 100,000).
Figure 17
SEM micrograph of the remineralized dentin of pH 5.5 group at 70 µm area from the surface layer (× 100,000).
Figure 1
Figure 2
Figure 3
Figure 4
Figure 5
Figure 6
Figure 7
Figure 8
Figure 9
Figure 10
Figure 11
Figure 12
Figure 13
Figure 14
Figure 15
Figure 16
Figure 17
The effect of the pH of remineralized buffer solutions on dentin remineralization
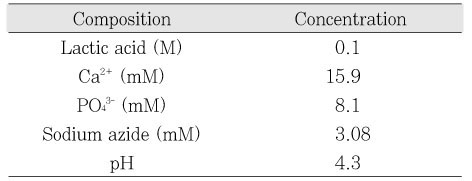
Initial composition of demineralization solution
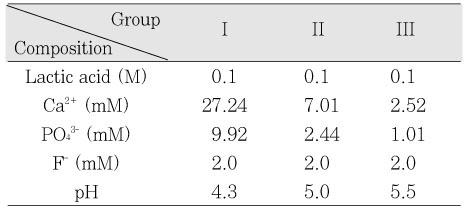
Initial composition of remineralization solution
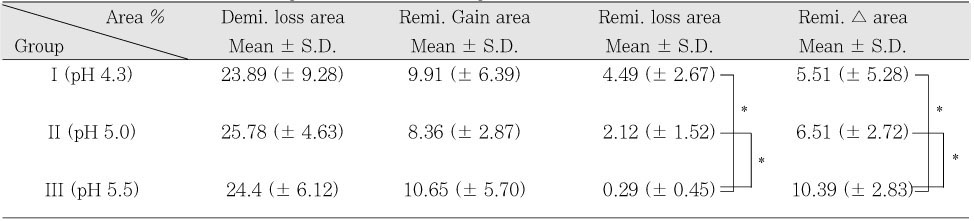
Quantitative mineral change (%) of dentin during de-& remineralization
*: p < 0.05
Table 1
Initial composition of demineralization solution
Table 2
Initial composition of remineralization solution
Table 3
Quantitative mineral change (%) of dentin during de-& remineralization
*: p < 0.05

