
Articles
- Page Path
- HOME > Restor Dent Endod > Volume 42(1); 2017 > Article
- Open Lecture on Statistics Statistical notes for clinical researchers: Risk difference, risk ratio, and odds ratio
- Hae-Young Kim
-
2017;42(1):-76.
DOI: https://doi.org/10.5395/rde.2017.42.1.72
Published online: January 9, 2017
Department of Health Policy and Management, College of Health Science, and Department of Public Health Sciences, Graduate School, Korea University, Seoul, Korea.
- Correspondence to Hae-Young Kim, DDS, PhD. Associate Professor, Department of Health Policy and Management, College of Health Science, and Department of Public Health Sciences, Graduate School, Korea University, 145 Anam-ro, Seongbukgu, Seoul, Korea 02841. TEL, +82-2-3290-5667; FAX, +82-2-940-2879; kimhaey@korea.ac.kr
©Copyrights 2017. The Korean Academy of Conservative Dentistry.
This is an Open Access article distributed under the terms of the Creative Commons Attribution Non-Commercial License (http://creativecommons.org/licenses/by-nc/3.0/) which permits unrestricted non-commercial use, distribution, and reproduction in any medium, provided the original work is properly cited.
- 8,946 Views
- 85 Download
- 40 Crossref

Tables & Figures
REFERENCES
Citations
Citations to this article as recorded by 
- Reply to Lai and Huang, “Which beta-lactam infusion strategy is superior in ICU pneumonia? A Bayesian network meta-analysis of continuous, extended, and intermittent approaches”
Yixuan Li, Jason A. Roberts, Mohd H. Abdul-Aziz, Fekade B. Sime, James E. Leggett
Antimicrobial Agents and Chemotherapy.2026;[Epub] CrossRef - Meta-analytic and systematic review of the diagnostic value of DNA methylation-based biomarkers in cervical cancer
Hue Hong Thieu, Thuy Ai Huyen Le, Thuan Duc Lao
The International Journal of Biological Markers.2026;[Epub] CrossRef - Confidence intervals for risk difference of two independent negative binomial proportions using method of variance estimates recovery
Chao Chen, Min Zhu, Qianrong Xu, Yuxuan Liu, Huan Tang, Meiyi Wu, Zhizhong Wang, Yanting Chen
Journal of Statistical Computation and Simulation.2026; : 1. CrossRef - Integrating patient-reported weight gain cause narratives into personalized obesity management: a data-driven approach with natural language processing and machine learning
Miksa M. Henkrich, Maitane Nuñez-Garcia, Ignacio Sajoux, Begoña de Cuevillas, Juan José López-Gómez, J. Alfredo Martínez, Daniel de Luis
Frontiers in Nutrition.2026;[Epub] CrossRef - Interpreting Research Findings in Endodontics: A Biostatistical Primer
Mehran Farajollahi, Amir Azarpazhooh, Ali Nosrat, Shima Saber Tahan, Ove A. Peters
Journal of Endodontics.2026; 52(8): 1254. CrossRef - Subdural and epidural hematoma following lumbar puncture in patients on anticoagulants or antiplatelets: A retrospective propensity score-matched registry study
Jinpyo Hong, David R. Hallan, Mason T. Stoltzfus, Manuel Bita, Kunal Koka, Elias Rizk
Acta Neurologica Belgica.2026;[Epub] CrossRef - Out-of-home care and criminal conviction trajectories from adolescence to midlife: A Swedish prospective cohort study of siblings
Süheyla Seker, Hilma Forsman, Glena Hossein, Martin Steppan, Lars Brännström
Child Abuse & Neglect.2026; 177: 108083. CrossRef - Prenatal exposure to asthma medications and risk of neurodevelopmental disorders and educational difficulties: A systematic review and meta-analysis
Lama A. Shakhshir, Alexia Karain, Jill P. Pell, Claire E. Hastie, Scott M. Nelson, Michael Fleming, Jennifer Elizabeth Jardine
PLOS Medicine.2026; 23(6): e1005100. CrossRef - Клініко-патогенетичне обґрунтування використання селективного ентеросорбенту Альпесорб при гострих кишкових інфекціях з діарейним синдромом
Андросова О.С., Галецька В.Г., Козловський В.О., Колесник О.М., Куляс С.М., Мороз Л.В., Попович О.О., Шмалій В.І.
Ukrainian Medical Journal.2026;[Epub] CrossRef - AttributeRank: An Algorithm for Attribute Ranking in Clinical Variable Selection
Donald Douglas Atsa'am, Ruth Wario, Pakiso Khomokhoana
Journal of Evaluation in Clinical Practice.2025;[Epub] CrossRef - Safety of RTS,S/AS01E vaccine for malaria in African children aged 5 to 17 months: A systematic review and meta-analysis of randomized controlled trials
Joseph Alexis Zoa, Rahi-metou Njemguie Linjouom, Martin Nyangono Ndongo, Jan Rene Nkeck, Alassane Dicko
PLOS Global Public Health.2025; 5(6): e0004387. CrossRef - Prenatal depression with comorbid diabetes or hypertension and the risk of adverse postnatal maternal health outcomes: a systematic review and meta-analysis
Biruk Beletew Abate, Berihun Assefa Dachew, Getinet Ayano, Kim Betts, Rosa Alati
Journal of Psychosomatic Research.2025; 196: 112341. CrossRef - Variation in coronary revascularisation and mortality after myocardial infarction across three public health insurance schemes in Thailand: an observational analysis from nationwide claims data
Woranan Witthayapipopsakul, Orawan Anupraiwan, Gumpanart Veerakul, Anne Mills, Ipek Gurol-Urganci, Jan van der Meulen
BMJ Public Health.2025; 3(2): e001264. CrossRef - An Evaluation of the Pathways Community HUB Approach To Improving Birth Outcomes: A Retrospective Study Using Propensity Score Matching in Richland, Ohio
Edward T. Chiyaka, Vinay K. Cheruvu, John A. Hoornbeek
Maternal and Child Health Journal.2025; 29(10): 1425. CrossRef - Prenatal depression comorbid with diabetes or hypertension and the risk of adverse neonatal outcomes: A systematic review and meta-analysis
Biruk Beletew Abate, Berihun Assefa Dachew, Getinet Ayano, Kim Betts, Rosa Alati
Annals of Epidemiology.2025; 111: 154. CrossRef - Risk of Cervical Dizziness in Patients With Cervical Spondylosis
Tzu-Pu Chang, Zheyu Wang, Xin-Xian Lee, Yu-Hung Kuo, Michael C. Schubert
JAMA Otolaryngology–Head & Neck Surgery.2024; 150(2): 93. CrossRef - Identifiability and Estimation for Potential-Outcome Means with Misclassified Outcomes
Shaojie Wei, Chao Zhang, Zhi Geng, Shanshan Luo
Mathematics.2024; 12(18): 2801. CrossRef - Reply to: ‘Comment on Kridin et al.—Considering both relative and absolute risk differences in infection risk between biologics classes in patients with psoriasis’
Khalaf Kridin, Henner Zirpel, Noor Mruwat, Ralf J. Ludwig, Diamant Thaci
Journal of the European Academy of Dermatology and Venereology.2024;[Epub] CrossRef - Videolaryngoscopy during Urgent Cesarean Delivery: Association with Neonatal Intensive Care Unit Admission
Andrew King, Julie-Ann Thompson, Stewart Hart, Bobby Nossaman
Southern Medical Journal.2024; 117(8): 494. CrossRef - Application of Meta-analysis for Determining Cancer Biomarkers
Halil İbrahim Pazarbaşı, Athanasia Pavlopoulou
Arşiv Kaynak Tarama Dergisi.2024; 33(3): 165. CrossRef - PRACTICAL EXPERIENCE OF USING NANO-SILVER PREPARATIONS IN COMPLEX TREATMENT OF CHILDREN WITH ACUTE ADENOIDITIS
Yuriy V Shevchuk, Zhanna A Tereshchenko
OTORHINOLARYNGOLOGY.2024; : 19. CrossRef - The associations of maternal and paternal obesity with latent patterns of offspring BMI development between 7 and 17 years of age: pooled analyses of cohorts born in 1958 and 2001 in the United Kingdom
William Johnson, Snehal M. Pinto Pereira, Silvia Costa, Jennifer L. Baker, Tom Norris
International Journal of Obesity.2023; 47(1): 39. CrossRef - Treatment with Cinnabsin in patients with acute and exacerbated chronic rhinosinusitis
Rumen Benchev, Dilyana Vicheva
Romanian Journal of Rhinology.2023; 13(52): 165. CrossRef - Bone marrow overexpression of SNAI1 is an early indicator of intrinsic drug resistance in patients with de novo acute myeloid leukemia
Mahmoud B. Y. Gouda, Naglaa M. Hassan, Eman I. Kandil
The Journal of Gene Medicine.2023;[Epub] CrossRef - Social support and psychosocial well-being among older adults in Europe during the COVID-19 pandemic: a cross-sectional study
Ji Lu, Juyang Xiong, Shangfeng Tang, Ghose Bishwajit, Shuyan Guo
BMJ Open.2023; 13(7): e071533. CrossRef - Cost-effectiveness analysis of encorafenib and binimetinib combination as first-line treatment for metastatic or unresectable BRAF V600-mutated metastatic melanoma in Russia
N. A. Avxentyev, Yu. V. Makarova
FARMAKOEKONOMIKA. Modern Pharmacoeconomics and Pharmacoepidemiology.2023; 16(3): 375. CrossRef - Stereotactic radiosurgery for cerebellopontine meningiomas: a systematic review and meta-analysis
Julian L. Gendreau, Kristin Sheaffer, Nicholas Macdonald, Caitlin Craft-Hacherl, Mickey Abraham, Nitesh V. Patel, Yehuda Herschman, James G. Lindley
British Journal of Neurosurgery.2023; 37(2): 199. CrossRef - Therapeutic Exercises and Modalities in Athletes With Acute Hamstring Injuries: A Systematic Review and Meta-analysis
Amornthep Jankaew, Jih-Ching Chen, Samatchai Chamnongkich, Cheng-Feng Lin
Sports Health: A Multidisciplinary Approach.2023; 15(4): 497. CrossRef - Flare-ups After Nonsurgical Retreatments: Incidence, Associated Factors, and Prediction
Ali Nosrat, Michael Valancius, Sahar Mehrzad, Omid Dianat, Prashant Verma, Anita Aminoshariae, Ashraf F. Fouad
Journal of Endodontics.2023; 49(10): 1299. CrossRef - Prevalence of mental health problems among children with long COVID: A systematic review and meta-analysis
Nurulhuda Mat Hassan, Hani Syahida Salim, Safiya Amaran, Nurul Izza Yunus, Nurul Azreen Yusof, Norwati Daud, Deborah Fry, Omar Enzo Santangelo
PLOS ONE.2023; 18(5): e0282538. CrossRef - Analysis of Airway Management for Cesarean Delivery: Use of Risk and Proportion Differences
Andrew King, Justin Morello, Allison Clark, Adrienne Ray, Colleen Martel, Roneisha McLendon, Anne McConville, Melissa Russo, Liane Germond, Bobby Nossaman
Southern Medical Journal.2022; 115(3): 198. CrossRef - Pathogenetic Significance of YBX1 Expression in Acute Myeloid Leukemia Relapse
Mahmoud B.Y. Gouda, Naglaa M. Hassan, Eman I. Kandil, Riham Abdel-Hamid Haroun
Current Research in Translational Medicine.2022; 70(3): 103336. CrossRef - Is the clinical performance of composite resin restorations in posterior teeth similar if restored with incremental or bulk-filling techniques? A systematic review and meta-analysis
Patrícia Valéria Manozzo Kunz, Letícia Maíra Wambier, Marina da Rosa Kaizer, Gisele Maria Correr, Alessandra Reis, Carla Castiglia Gonzaga
Clinical Oral Investigations.2022; 26(3): 2281. CrossRef - Expression and prognostic significance of chromatin modulators EHMT2/G9a and KDM2b in acute myeloid leukemia
Mahmoud B. Y. Gouda, Mohammed A. Zidane, Abdelhady Sayed Abdelhady, Naglaa M. Hassan
Journal of Cellular Biochemistry.2022; 123(8): 1340. CrossRef - Antimicrobial-associated organ injury among the elderly: a systematic review and meta-analysis protocol
Tichawona Chinzowu, Sandipan Roy, Prasad S Nishtala
BMJ Open.2022; 12(2): e055210. CrossRef - Bankruptcy among insured surgical patients with breast cancer: Who is at risk?
Samilia Obeng‐Gyasi, Lava R. Timsina, Oindrila Bhattacharyya, Carla S. Fisher, David A. Haggstrom
Cancer.2021; 127(12): 2083. CrossRef - Risk of Infection after Deep Brain Stimulation Surgery with Externalization and Local-Field Potential Recordings: Twelve-Year Experience from a Single Institution
Lucia K. Feldmann, Wolf-Julian Neumann, Katharina Faust, Gerd-Helge Schneider, Andrea A. Kühn
Stereotactic and Functional Neurosurgery.2021; 99(6): 512. CrossRef - Predicting Retention in HIV Primary Care: Is There a Missed Visits Continuum Based on Patient Characteristics?
Emma Sophia Kay, Ashley Lacombe-Duncan, Rogério M. Pinto
AIDS and Behavior.2019; 23(9): 2542. CrossRef - Prediction of running-induced Achilles tendinopathy with pain sensitivity – a 1-year prospective study
René B.K. Brund, Sten Rasmussen, Uwe G. Kersting, Lars Arendt-Nielsen, Thorvaldur Skuli Palsson
Scandinavian Journal of Pain.2019; 19(1): 139. CrossRef - Heart Rate and Bone Mineral Density in Older Women with Hypertension: Results from the Korea National Health and Nutritional Examination Survey
Mi‐Hyang Jung, Ho‐Joong Youn, Sang‐Hyun Ihm, Hae Ok Jung, Kyung‐Soon Hong
Journal of the American Geriatrics Society.2018; 66(6): 1144. CrossRef
 ePub Link
 Cite
CiteStatistical notes for clinical researchers: Risk difference, risk ratio, and odds ratio
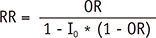
Figure 1 Relationship between odds ratio and relative risk at various levels of baseline risks in the control group (I0 = 0.5, 0.3, 0.2, 0.1, 0.05, and 0.01).1 I0, baseline risk of control group.
Figure 1
Statistical notes for clinical researchers: Risk difference, risk ratio, and odds ratio
An example of 2*2 cross table showing formulas of risk difference, risk ratio, and odds ratio
| Exposure | No exposure | Total | |
|---|---|---|---|
| Disease | a | b | a + b |
| No disease | c | d | c + d |
| Total | a + c | b + d | a + b + c + d |
| Risk (of disease) | a / (a + c) | b / (b + d) | |
| Odds | a / c | b / d | |
| Risk difference (RD) | (a / [a + c]) - (b / [b + d]) | ||
| Risk ratio (RR) | (a / [a + c]) / (b / [b + d]) | ||
| Odds ratio (OR) | (a / c) / (b / d) |
Comparison of risk difference, risk ratio, and odds ratio based on risks (p) and odds of two competitive groups (assume n = 1,000 per group)
| No. of event | Risk (p) | Odds | Risk difference | Risk ratio | Odds ratio | ||||
|---|---|---|---|---|---|---|---|---|---|
| Example | Control | Tx. | Control (1) | Tx. (2) | Control (3) | Tx. (4) | (2) - (1) | (2) / (1) | (4) / (3) |
| 1 | 1 | 2 | 0.001 | 0.002 | 0.001 | 0.002 | 0.001 | 2.000 | 2.000 |
| 2 | 5 | 10 | 0.005 | 0.010 | 0.005 | 0.010 | 0.005 | 2.000 | 2.000 |
| 3 | 10 | 20 | 0.010 | 0.020 | 0.010 | 0.020 | 0.010 | 2.000 | 2.000 |
| 4 | 15 | 30 | 0.015 | 0.030 | 0.015 | 0.031 | 0.015 | 2.000 | 2.067 |
| 5 | 50 | 100 | 0.050 | 0.100 | 0.053 | 0.111 | 0.050 | 2.000 | 2.096 |
| 6 | 100 | 200 | 0.100 | 0.200 | 0.111 | 0.250 | 0.100 | 2.000 | 2.252 |
| 7 | 200 | 400 | 0.200 | 0.400 | 0.250 | 0.667 | 0.200 | 2.000 | 2.668 |
| 8 | 200 | 700 | 0.200 | 0.700 | 0.250 | 2.333 | 0.500 | 3.500 | 9.333 |
| 9 | 500 | 200 | 0.500 | 0.200 | 1.000 | 0.250 | −0.300 | 0.400 | 0.250 |
| 10 | 500 | 600 | 0.500 | 0.600 | 1.000 | 1.500 | 0.100 | 1.200 | 1.500 |
| 11 | 500 | 700 | 0.500 | 0.700 | 1.000 | 2.333 | 0.200 | 1.400 | 2.333 |
| 12 | 500 | 990 | 0.500 | 0.990 | 1.000 | 99.00 | 0.490 | 1.980 | 99.00 |
| 13 | 900 | 950 | 0.900 | 0.950 | 9.000 | 19.00 | 0.050 | 1.060 | 2.111 |
| 14 | 998 | 999 | 0.998 | 0.999 | 499.0 | 999.0 | 0.001 | 1.001 | 2.002 |
Comparison of odds ratio (OR) and relative risk (RR) in two case-control designs with different size of no disease group
| Disease | No disease | Total | Disease | No disease | Total | ||
|---|---|---|---|---|---|---|---|
| Exposure | 10 | 100 | 110 | Exposure | 10 | 500 | 510 |
| No exposure | 5 | 100 | 105 | No exposure | 5 | 500 | 505 |
| OR = (10/100) / (5/100) = 2.00 | OR = (10/500) / (5/500) = 2.00 | ||||||
| RR = (10/110) / (5/105) = 1.91 | RR = (10/510) / (5/505) = 1.98 | ||||||
Table 1 An example of 2*2 cross table showing formulas of risk difference, risk ratio, and odds ratio
Table 2 Comparison of risk difference, risk ratio, and odds ratio based on risks (p) and odds of two competitive groups (assume n = 1,000 per group)
Table 3 Comparison of odds ratio (OR) and relative risk (RR) in two case-control designs with different size of no disease group

